British TV Shows
Sorting:
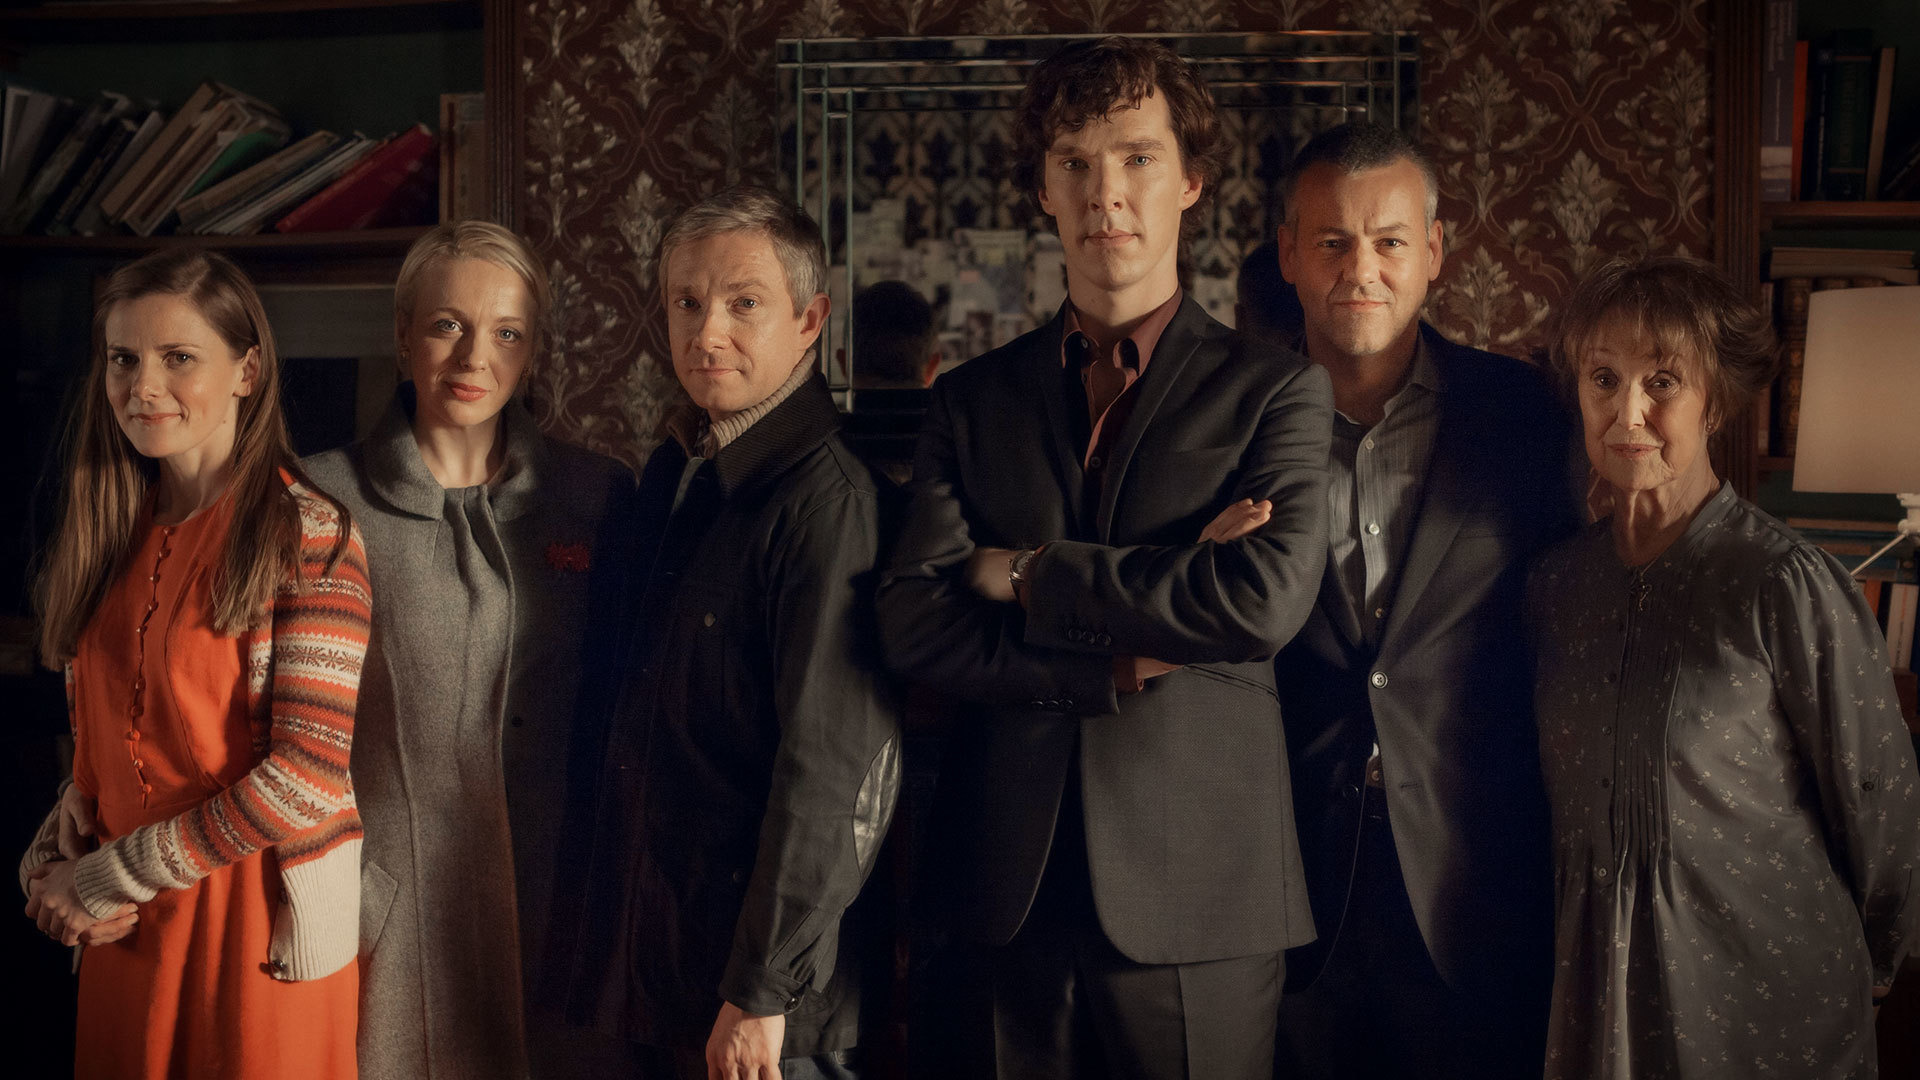
Sherlock
Crime, Drama, Mystery
2010, UK
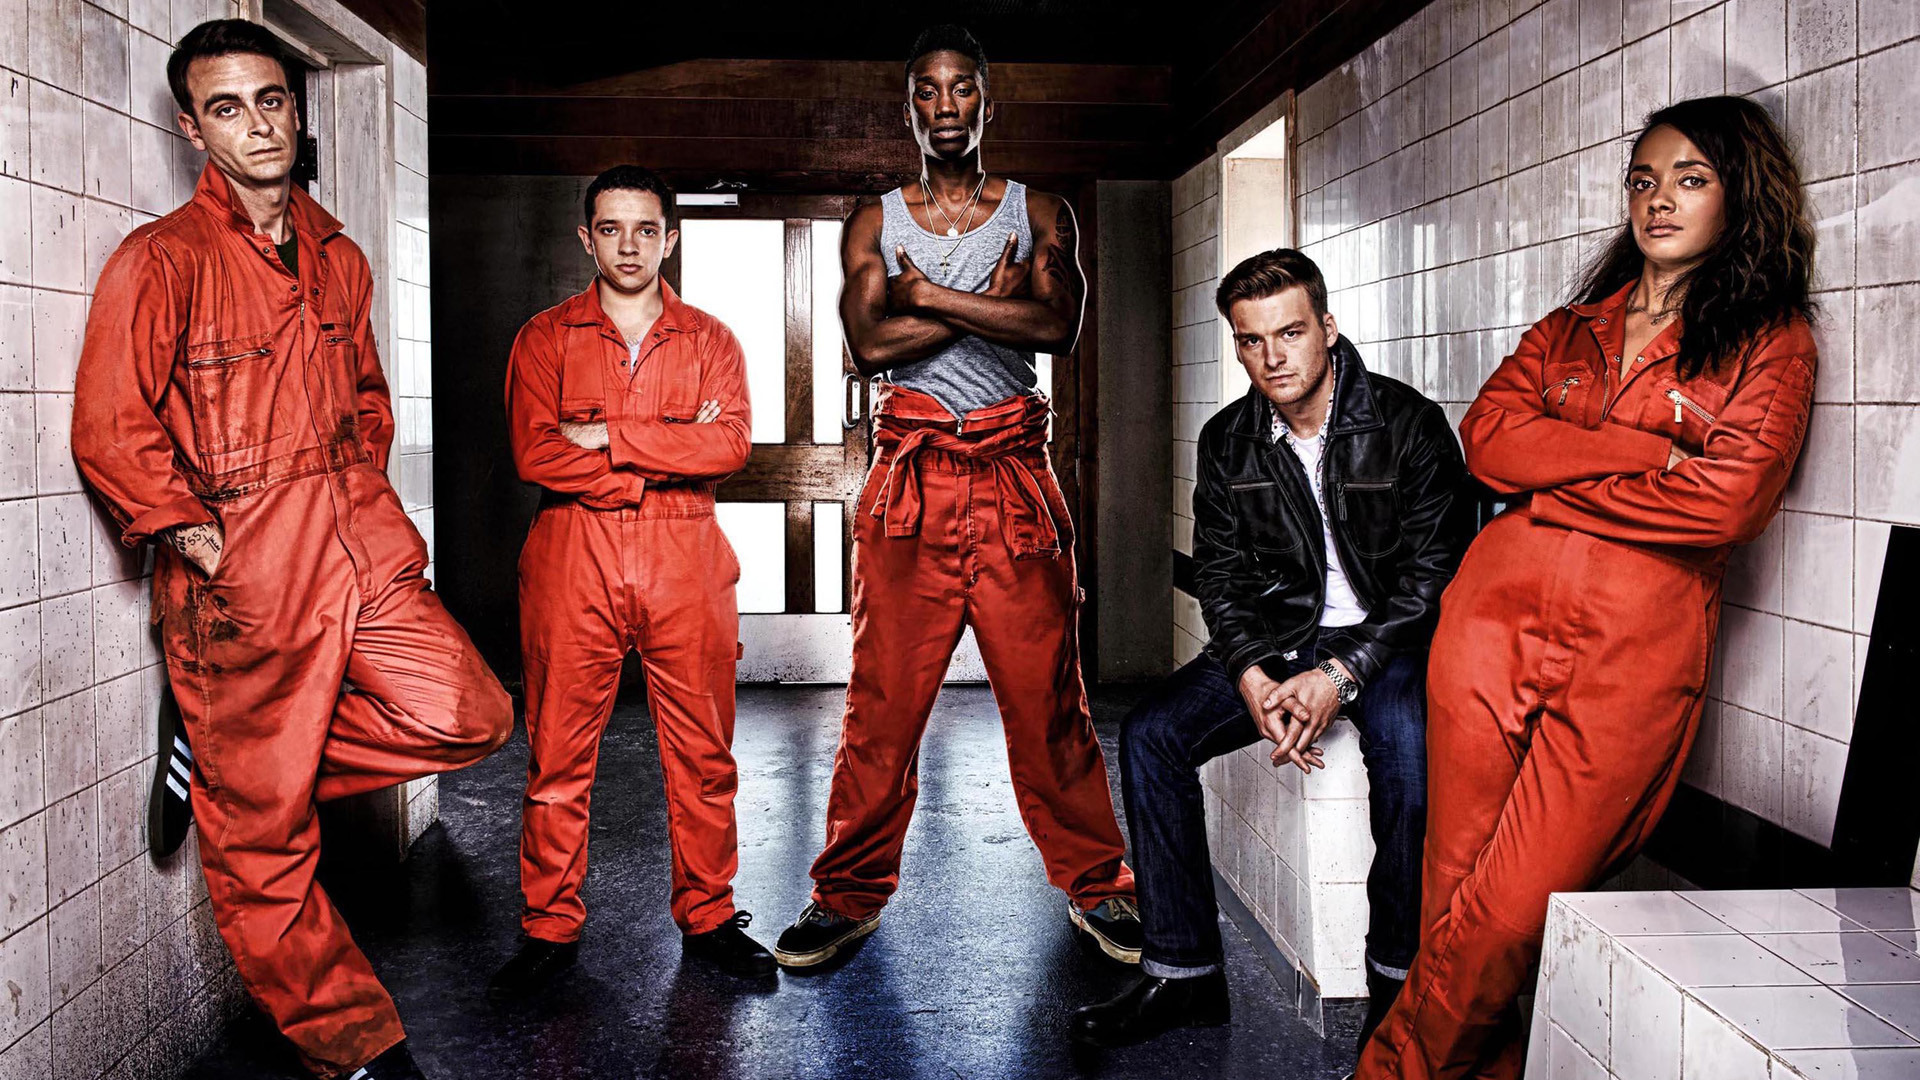
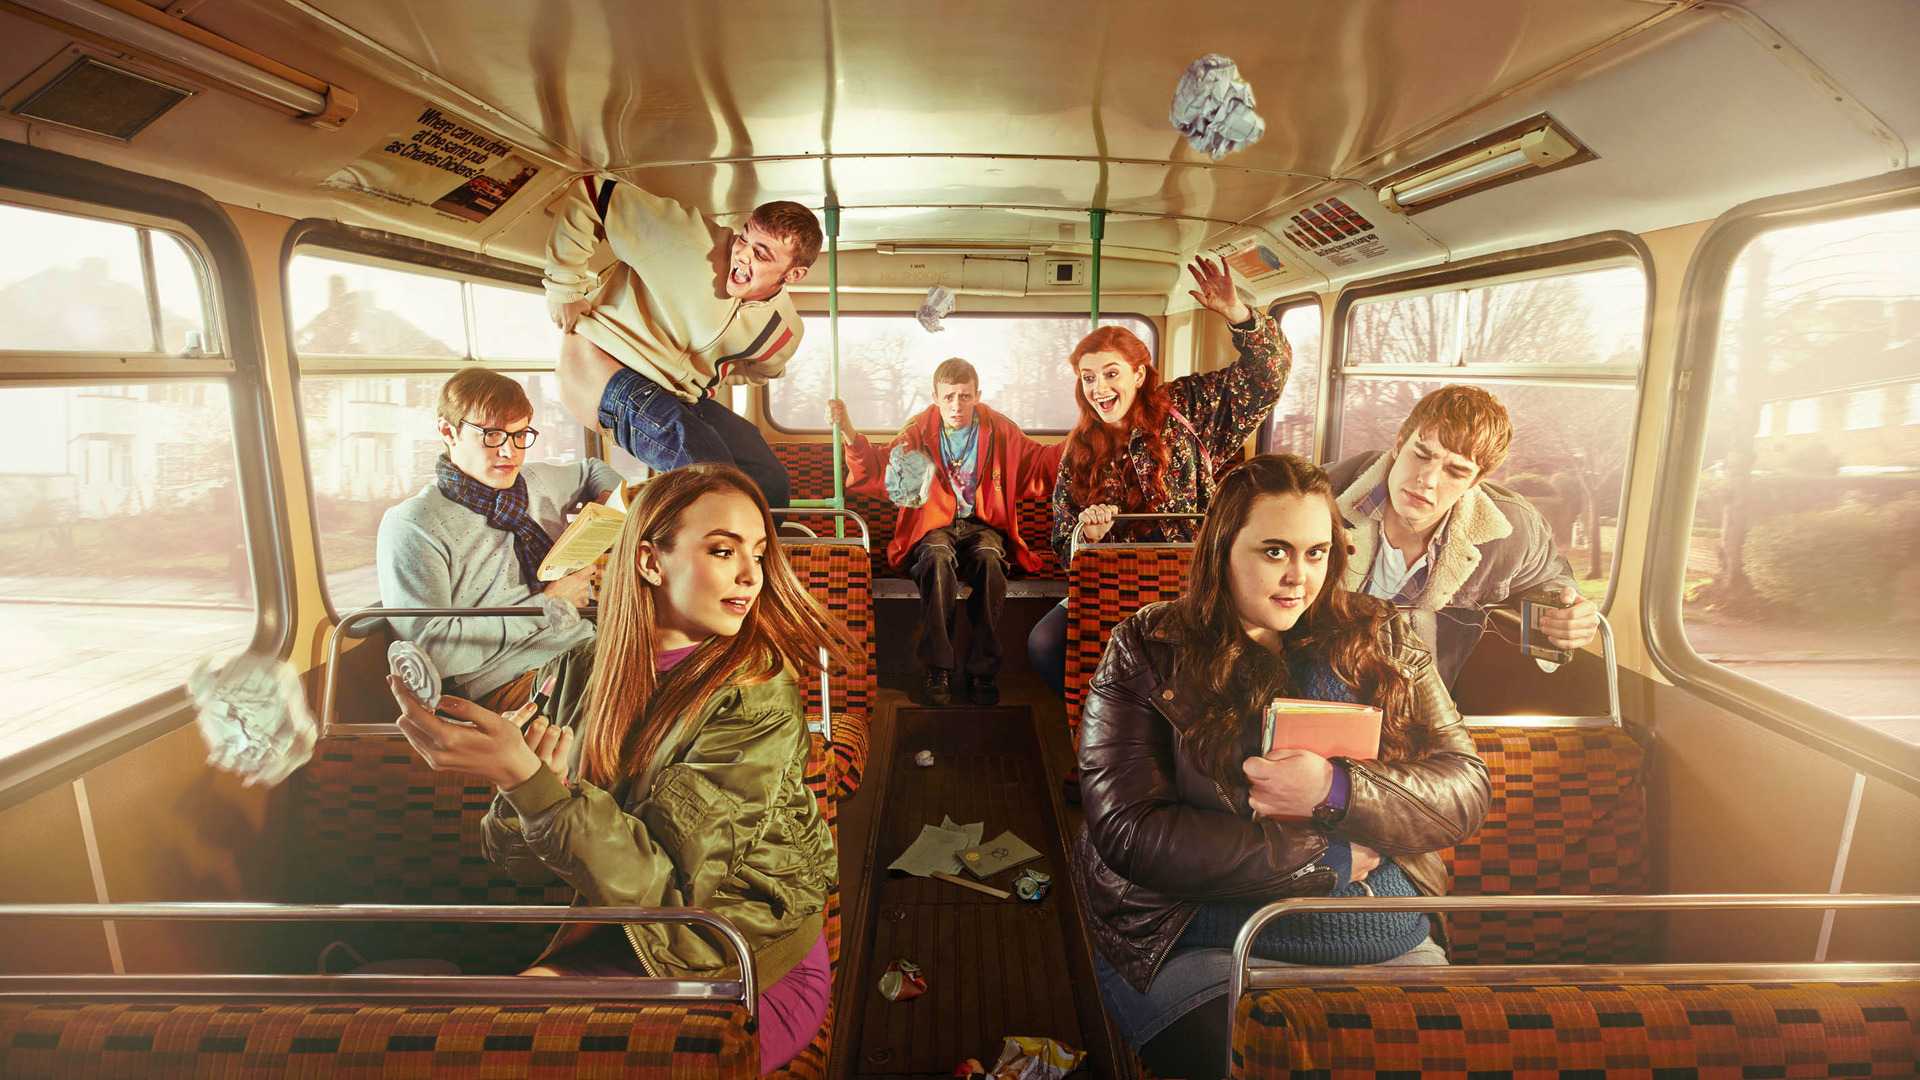
Misfits
Comedy, Drama, Sci-Fi
2009, UK

Sex Education
Comedy, Drama, Romance/Dating
2019, UK

Peaky Blinders
Crime, Drama, History
2013, UK
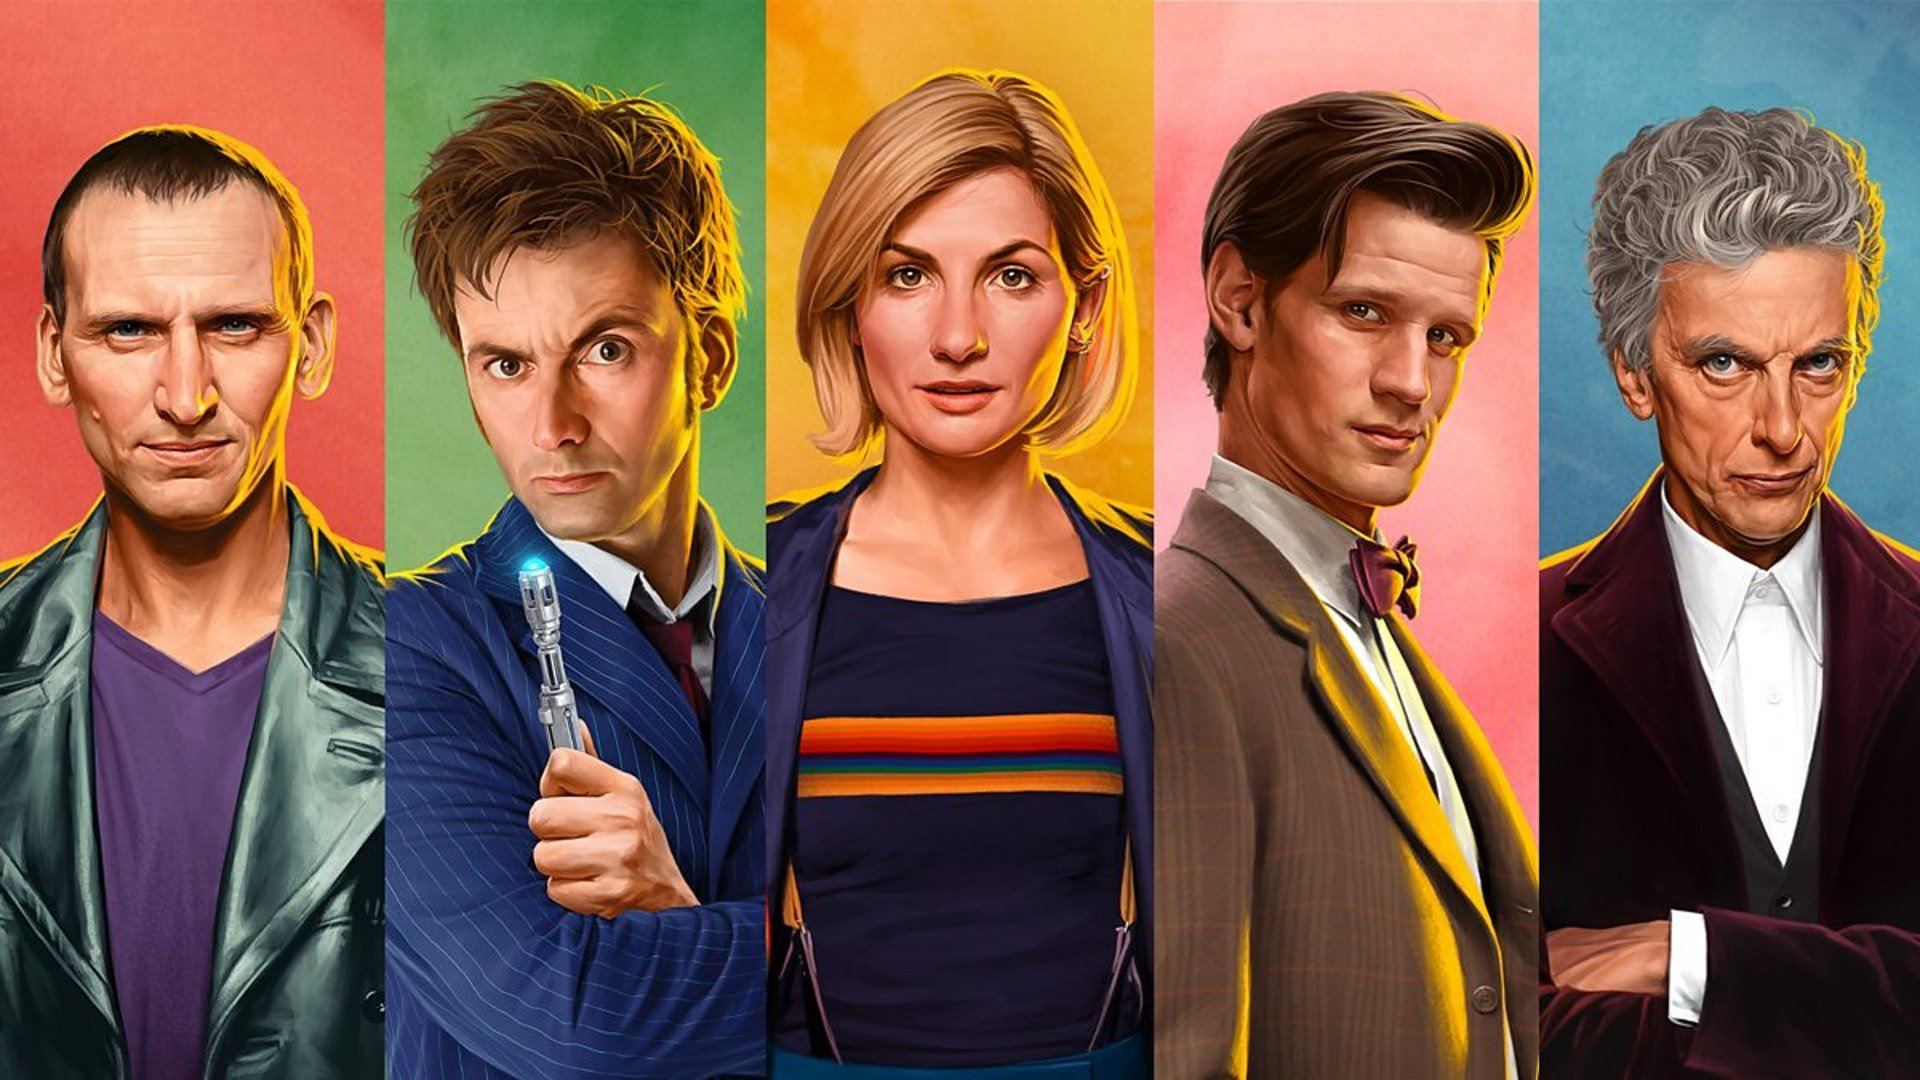
Doctor Who
Adventure, Drama, Sci-Fi
2005, UK

Skins
Comedy, Drama
2007, UK

The End of the F***ing World
Comedy, Drama
2017, UK
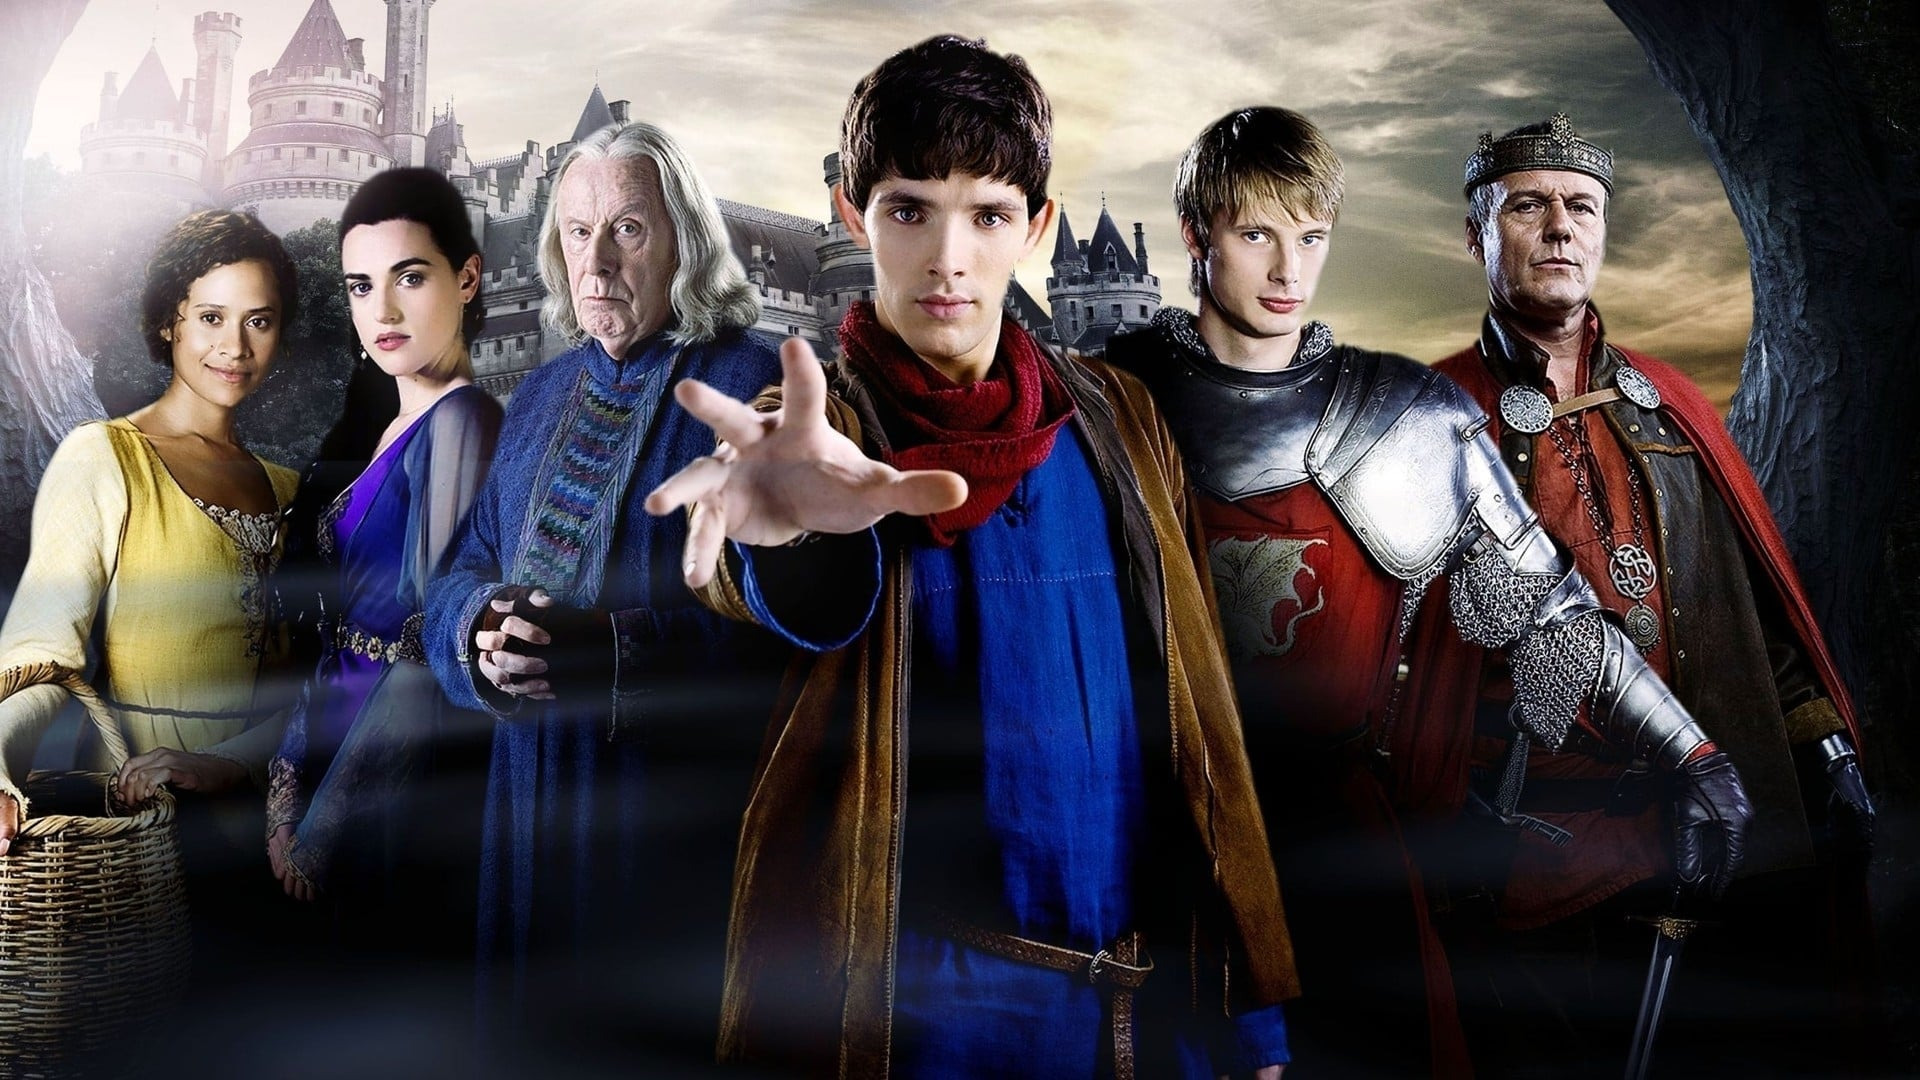
Merlin
Adventure, Fantasy
2008, UK
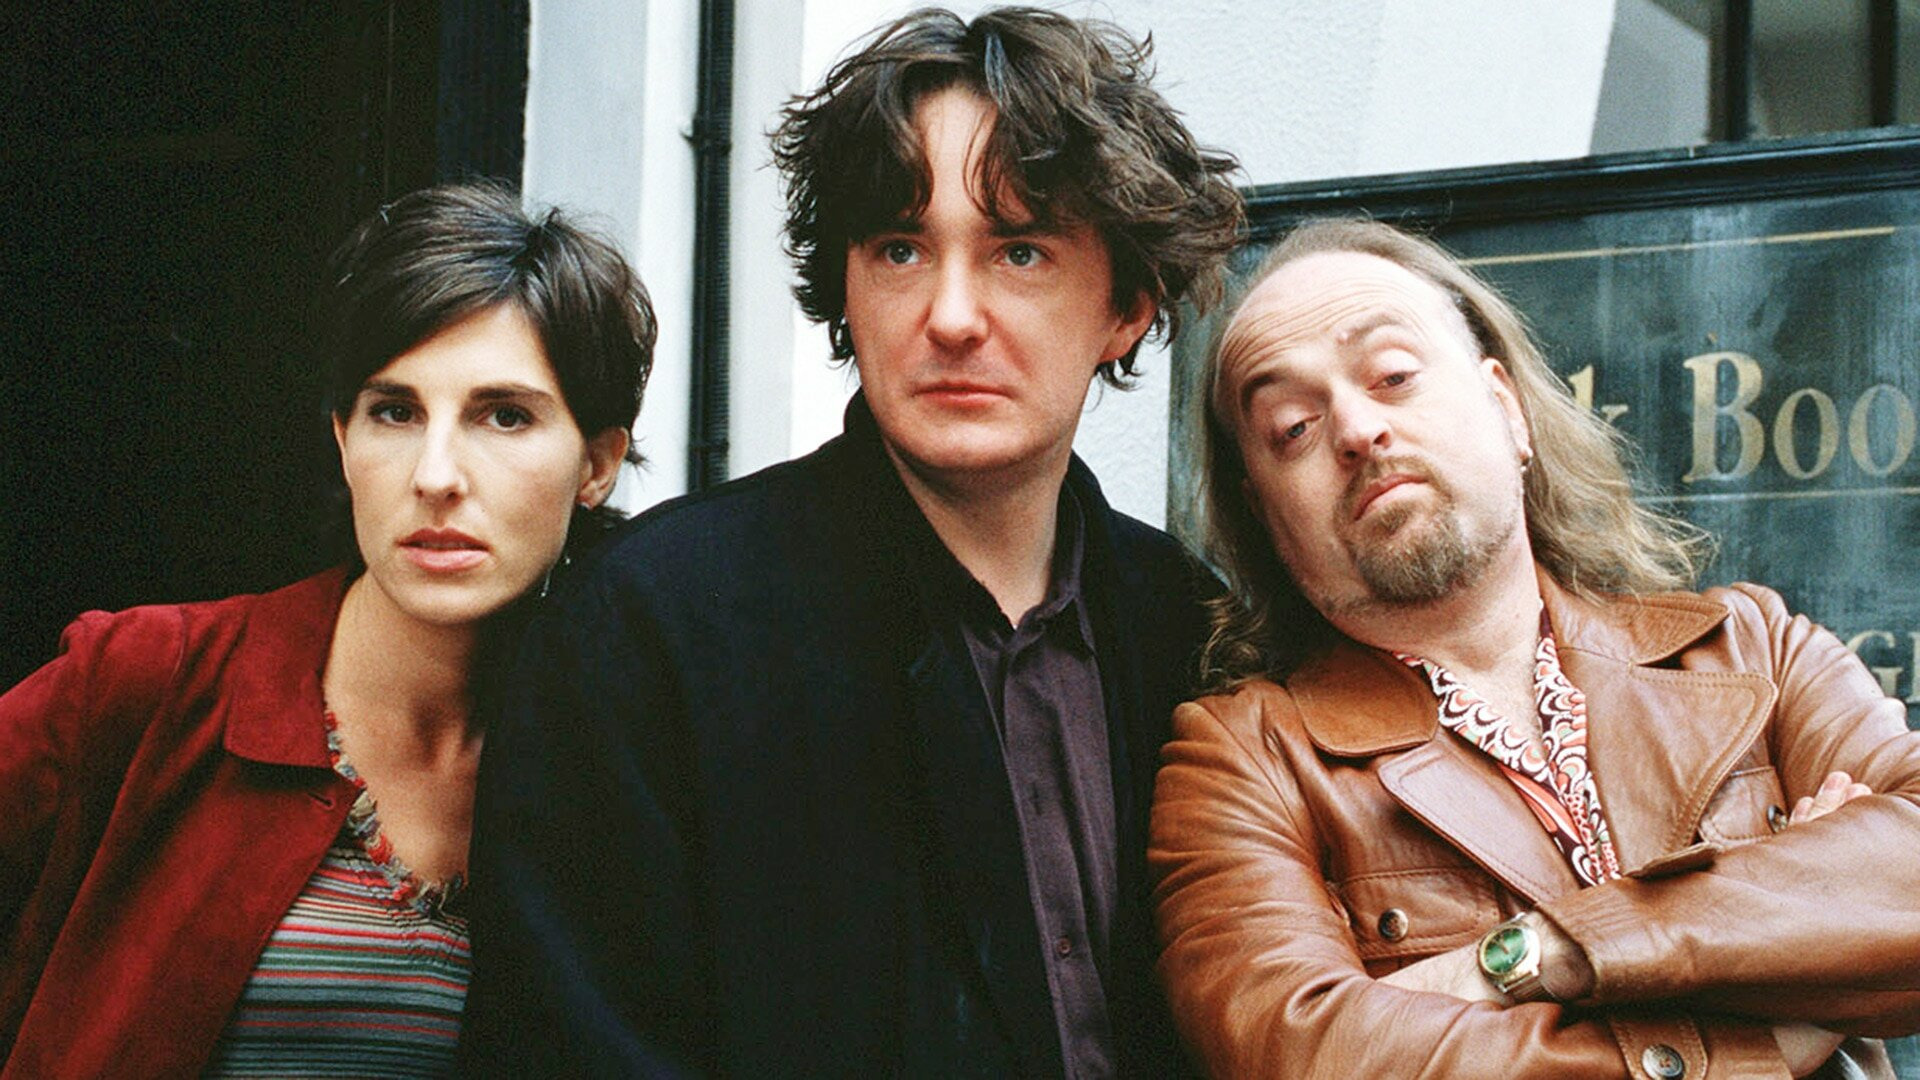
Black Books
Comedy
2000, UK
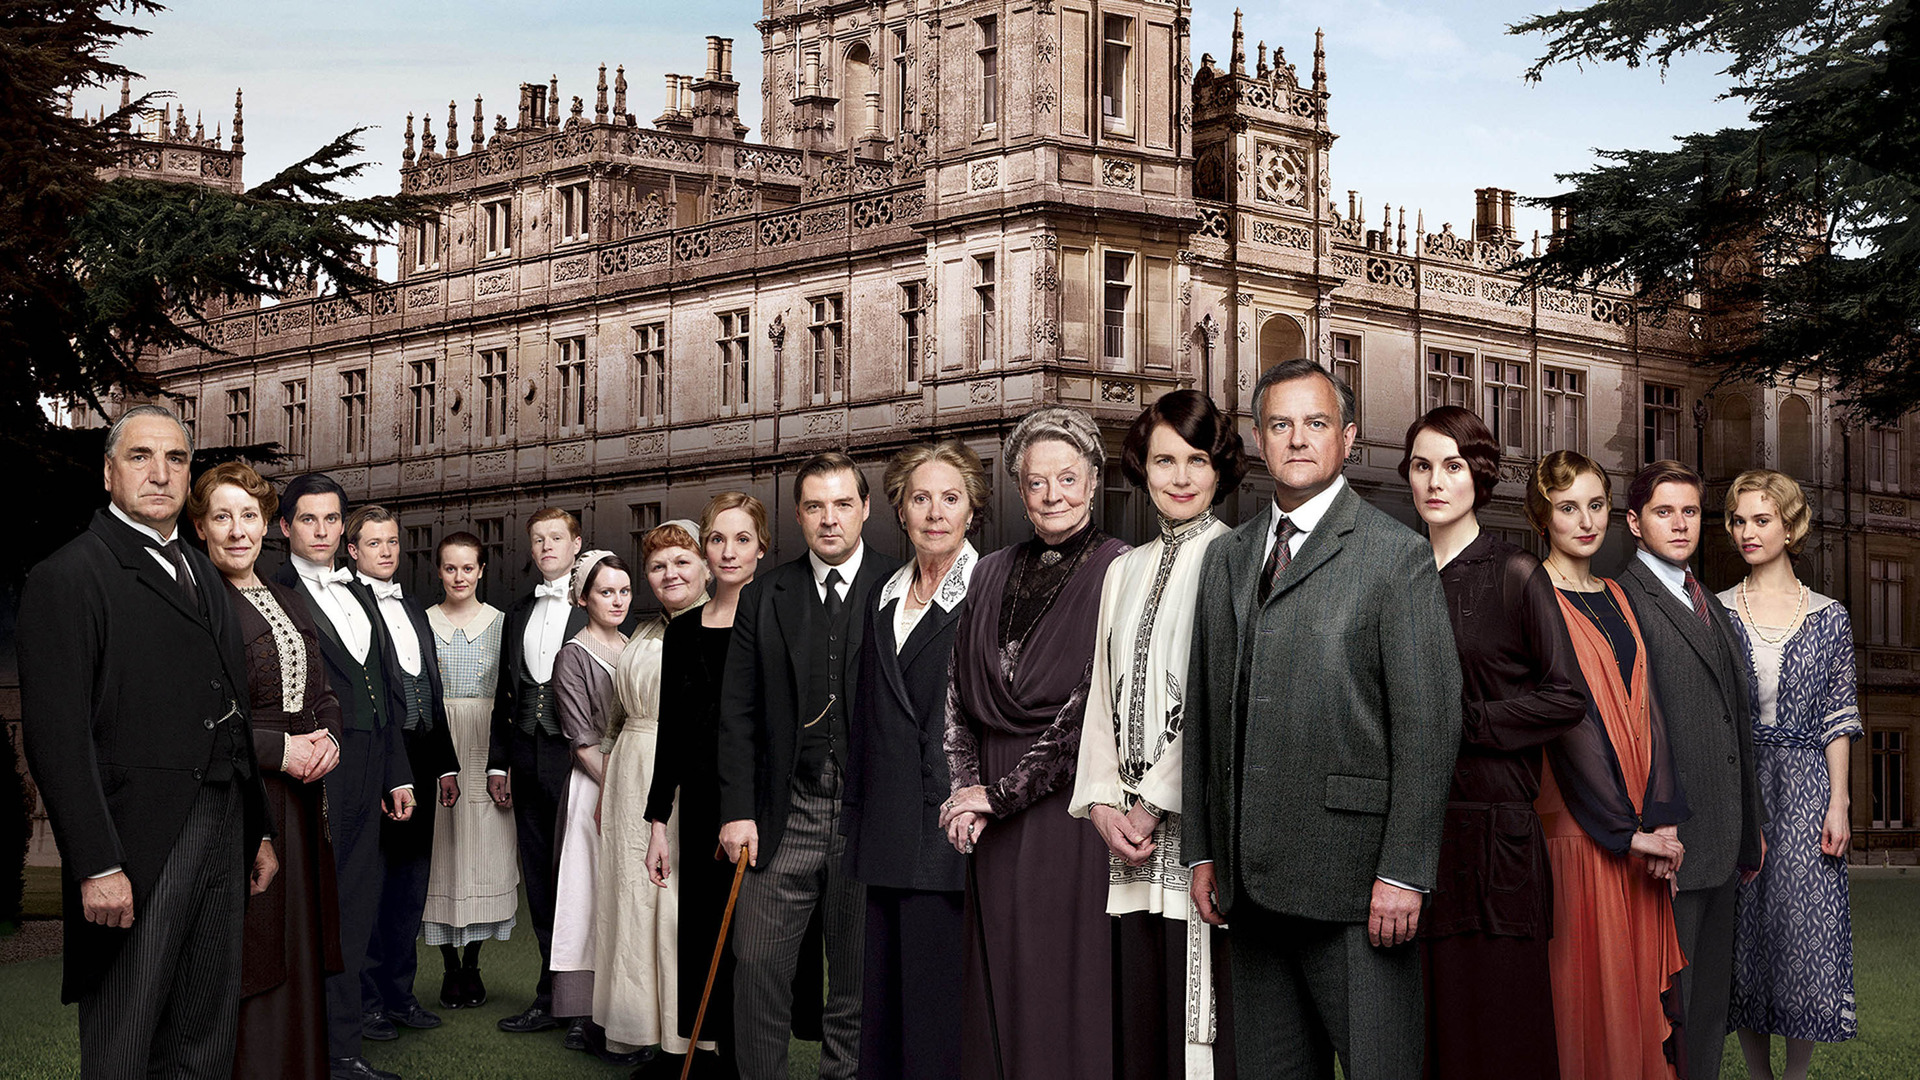
Downton Abbey
Drama, Family, Romance/Dating
2010, UK
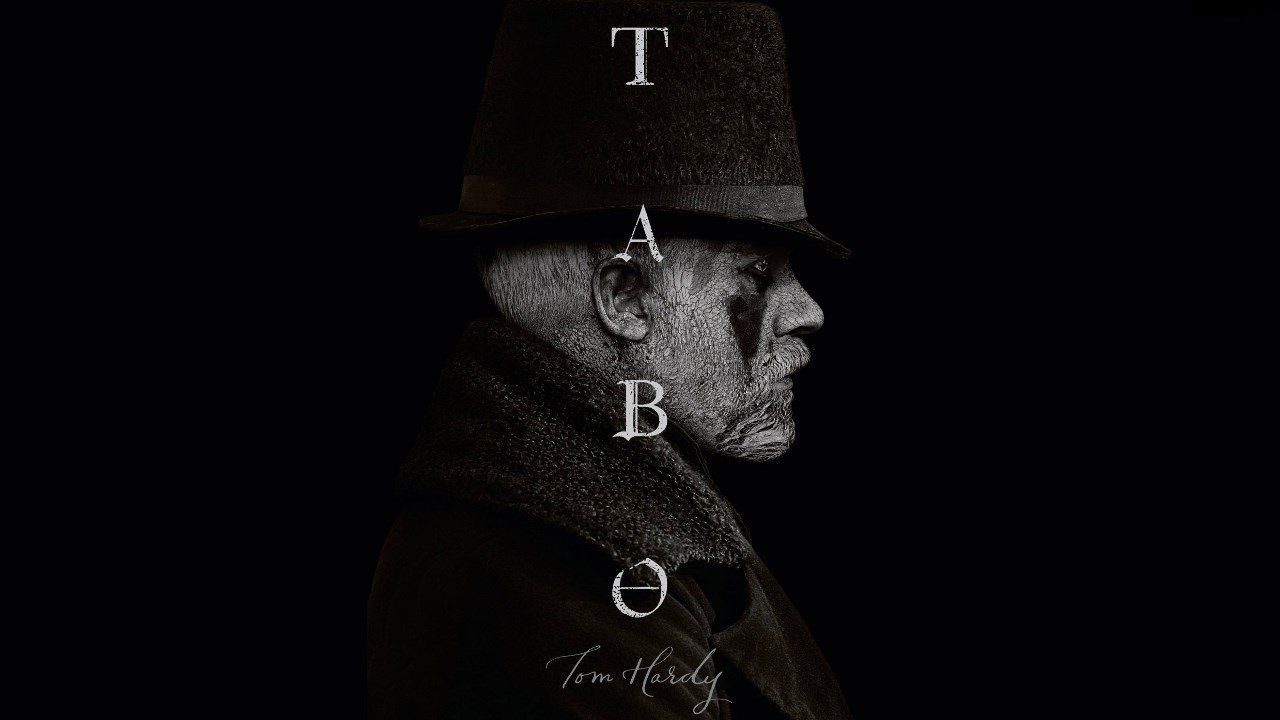
Taboo
Drama, Mystery, Thriller
2017, UK

The IT Crowd
Comedy
2006, UK

Brassic
Comedy, Crime, Drama
2019, UK
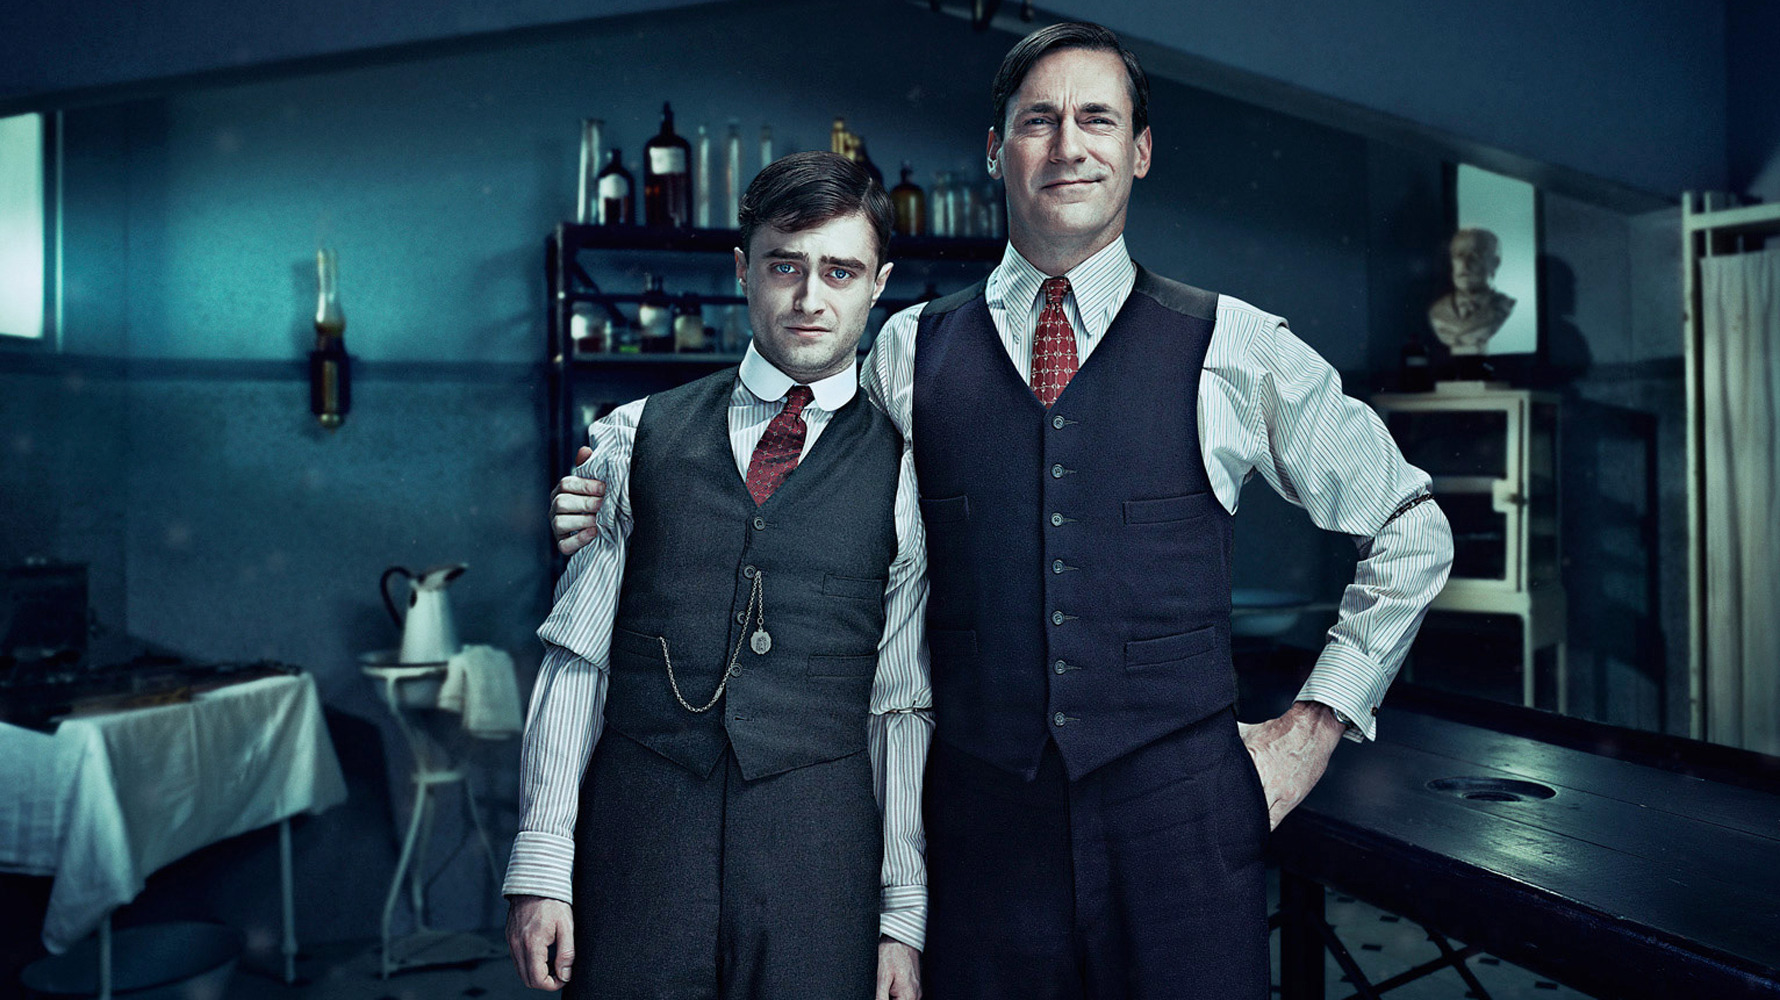
A Young Doctor's Notebook
Comedy, Drama
2012, UK
My Mad Fat Diary
Comedy, Drama, Romance/Dating
2013, UK

Fleabag
Comedy, Drama
2016, UK

The Night Manager
Drama, Spy/Espionage, Thriller
2016, UK
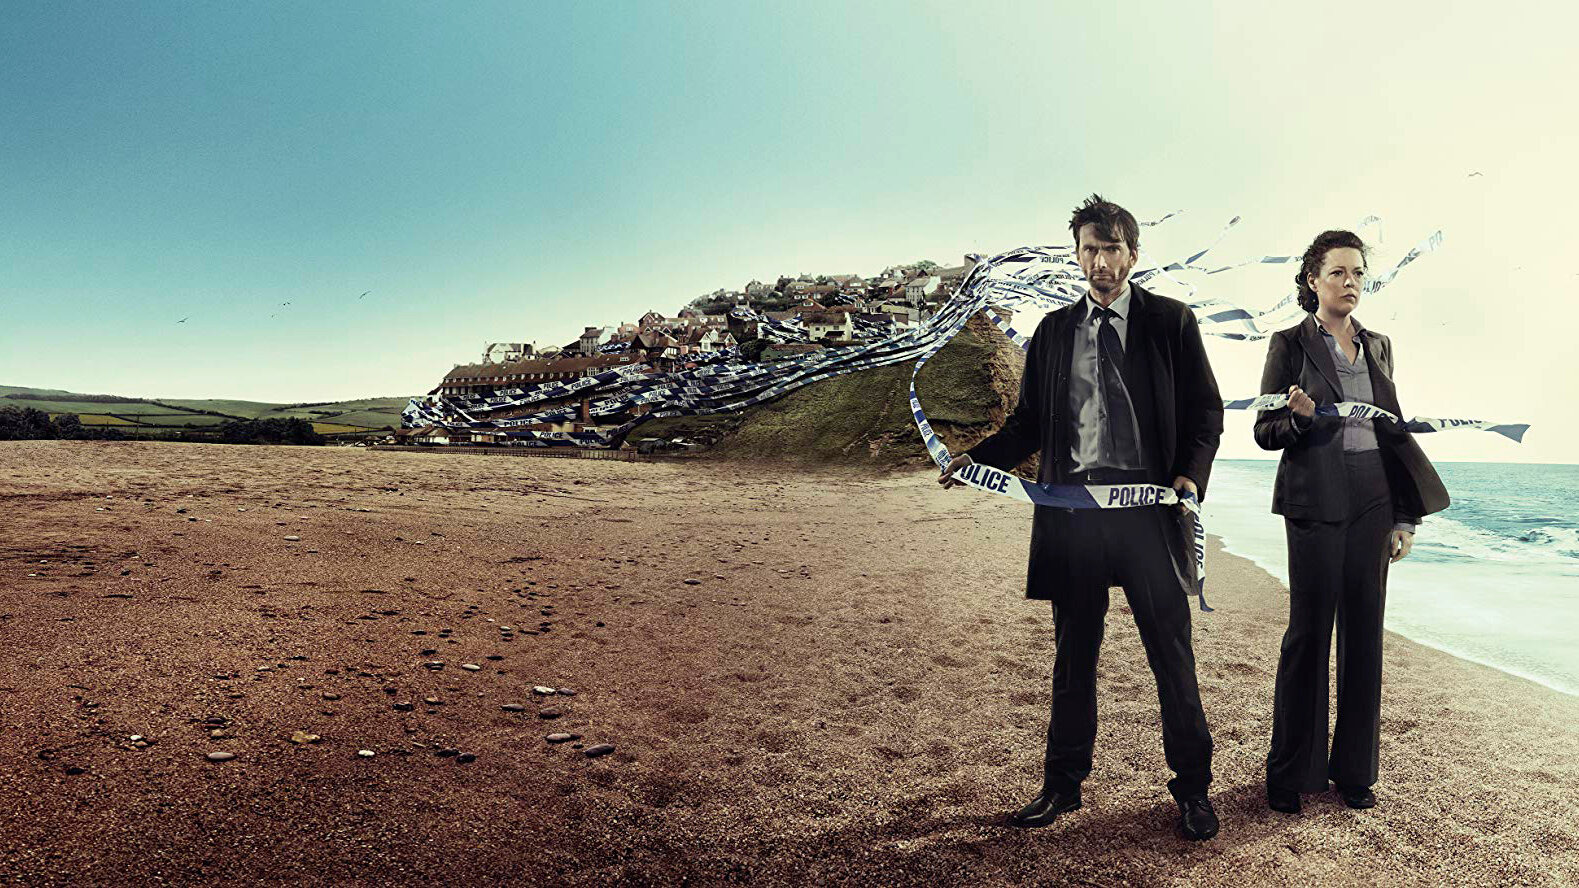
Broadchurch
Crime, Drama, Mystery
2013, UK

His Dark Materials
Adventure, Drama, Fantasy
2019, UK
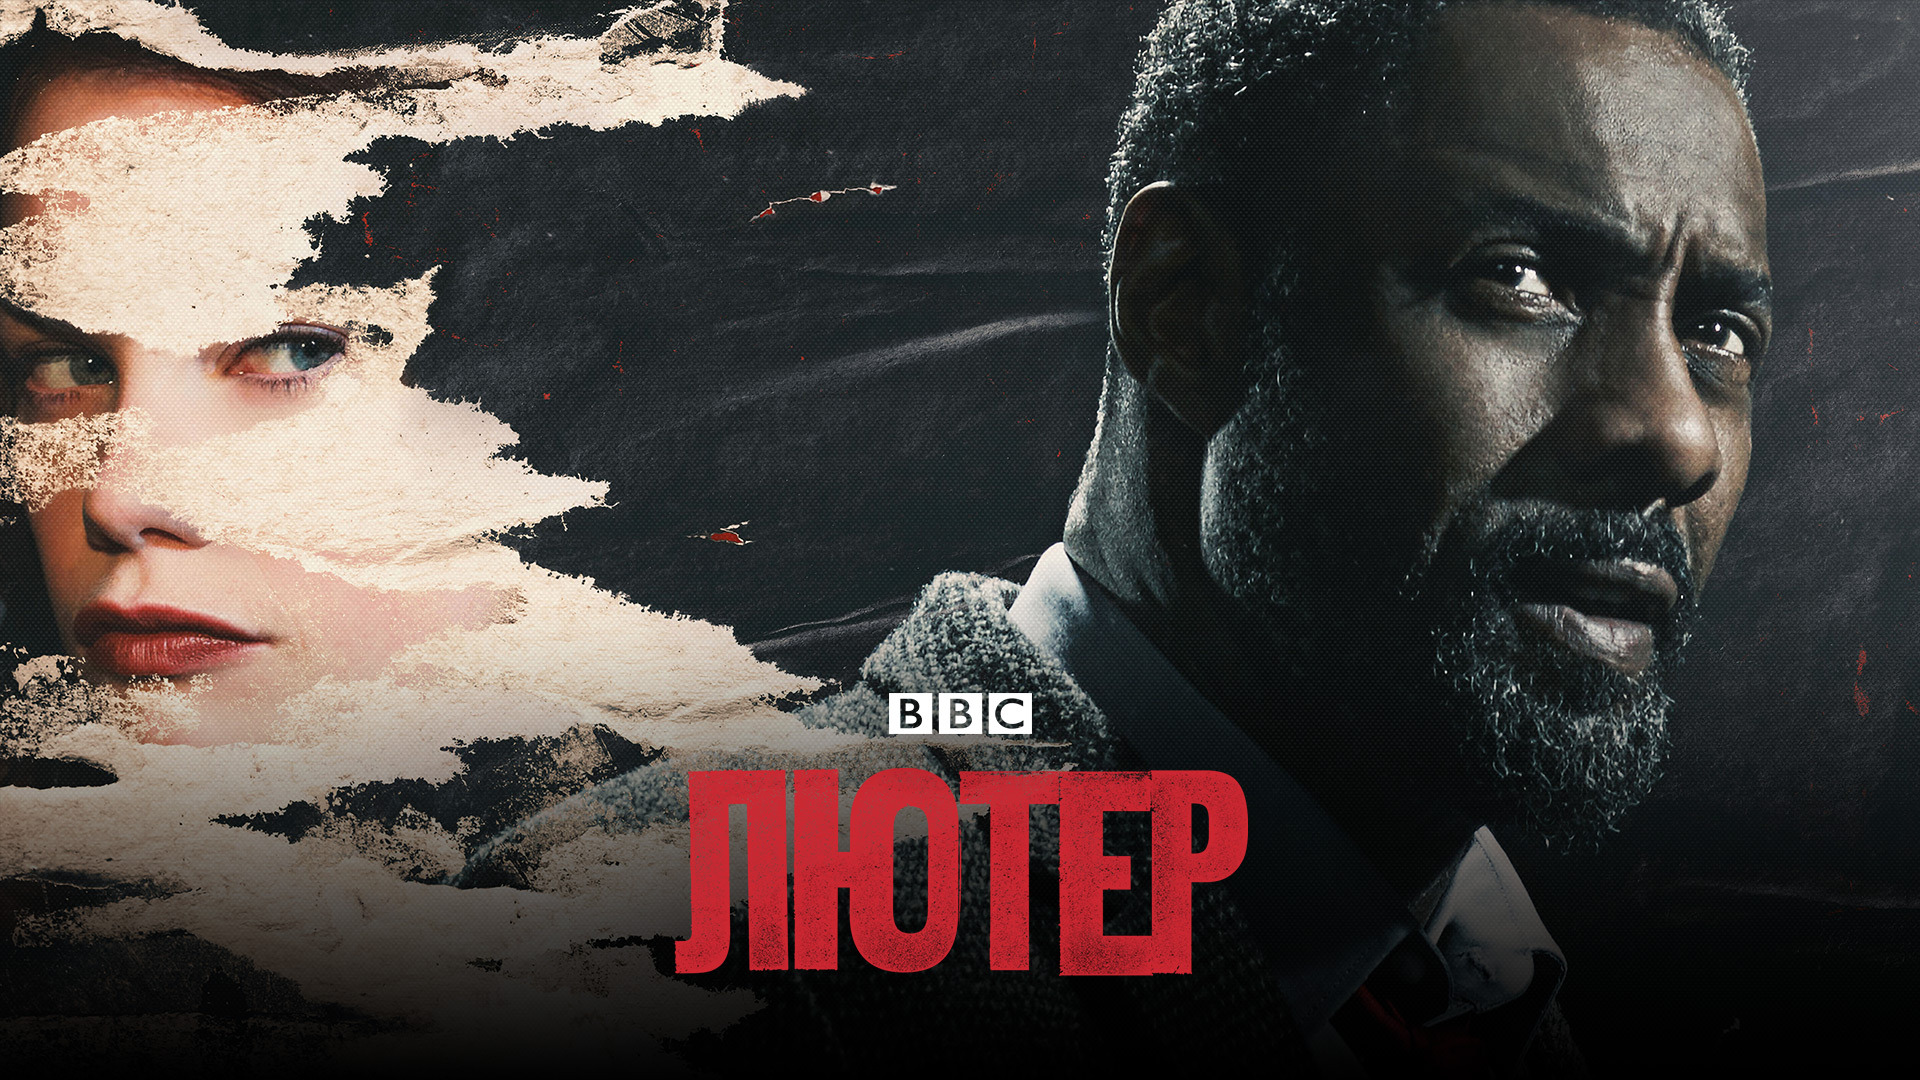
Luther
Crime, Drama, Thriller
2010, UK

Torchwood
Drama, Sci-Fi
2006, UK

Secret Diary of a Call Girl
Adult/Porn, Drama
2007, UK
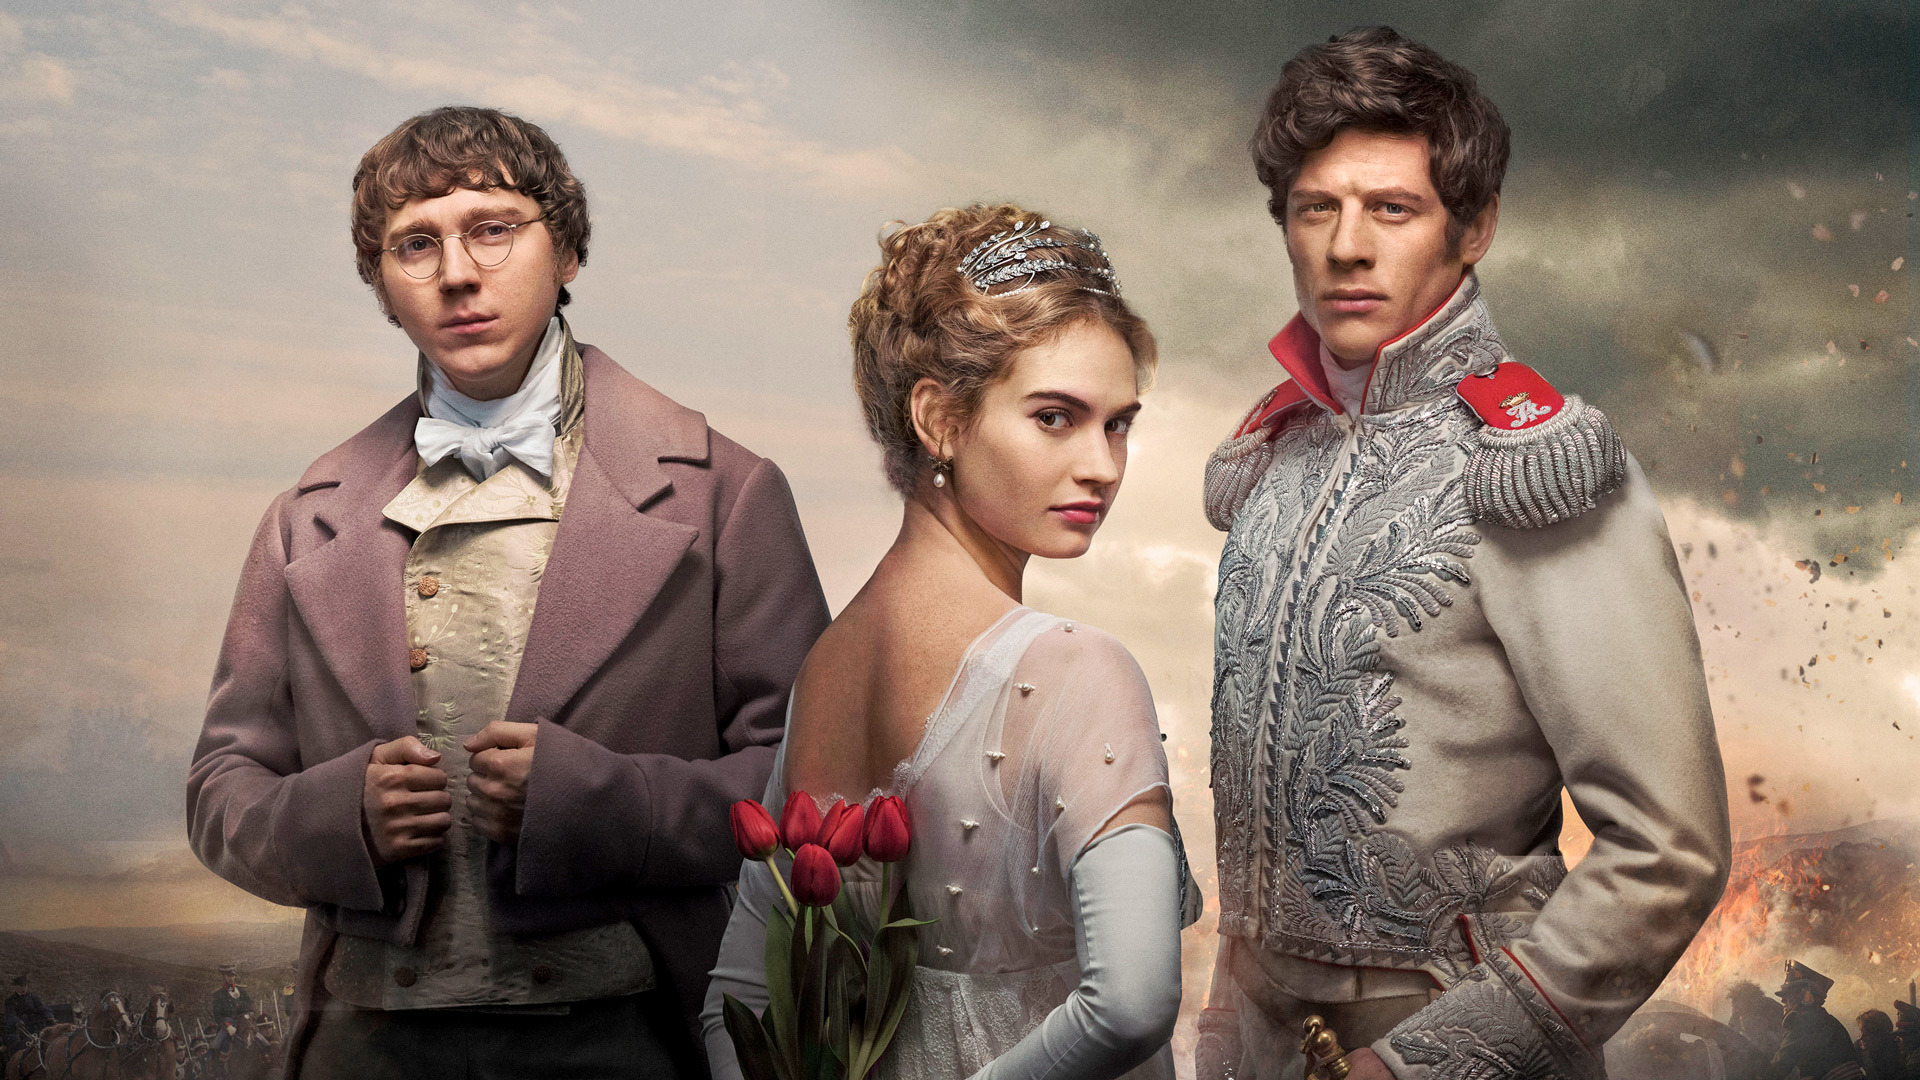
War & Peace
Drama, History, Romance/Dating
2016, UK

Behind Her Eyes
Drama, Mystery, Thriller
2021, UK
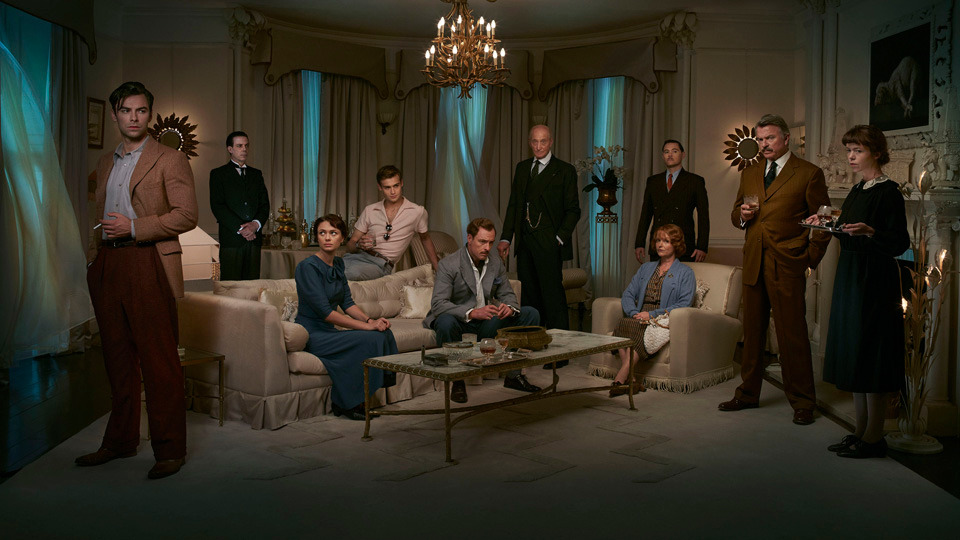
And Then There Were None
Crime, Drama, Mystery
2015, UK

Humans
Drama, Sci-Fi, Thriller
2015, UK

In the Flesh
Horror/Supernatural, Supernatural, Drama
2013, UK

The Fall
Crime, Drama, Thriller
2013, UK
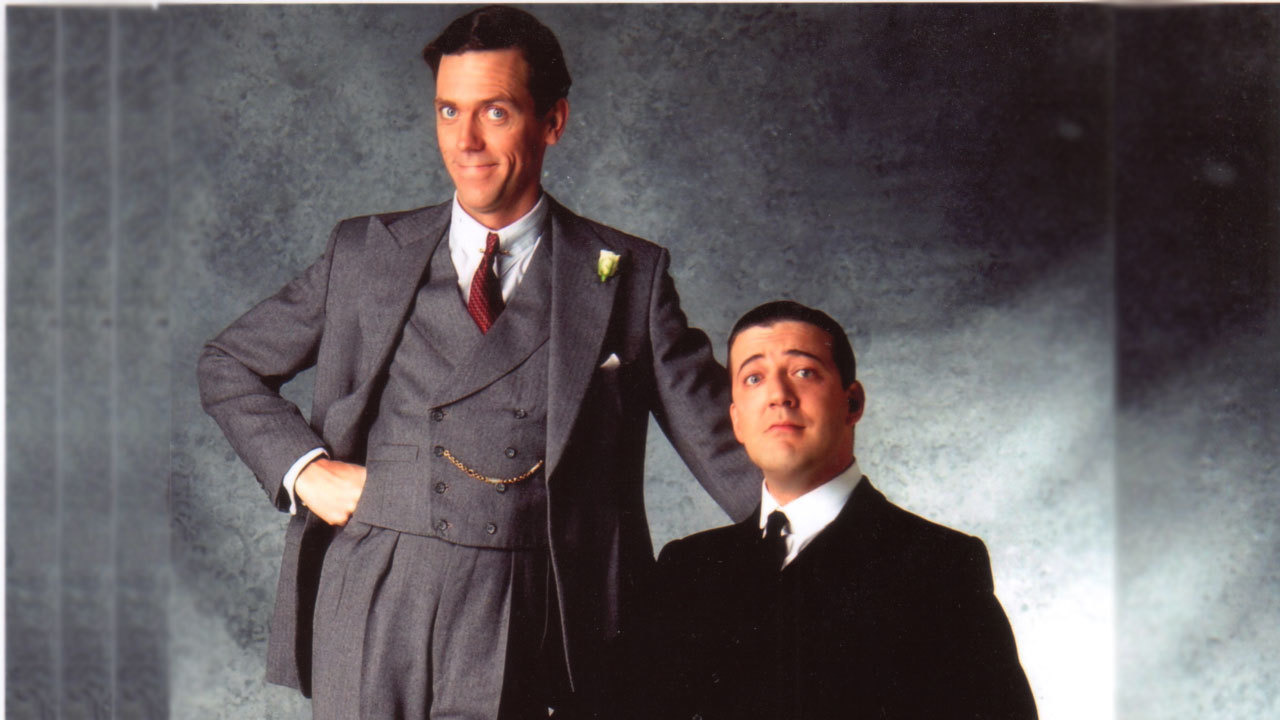
Jeeves & Wooster
Comedy
1990, UK
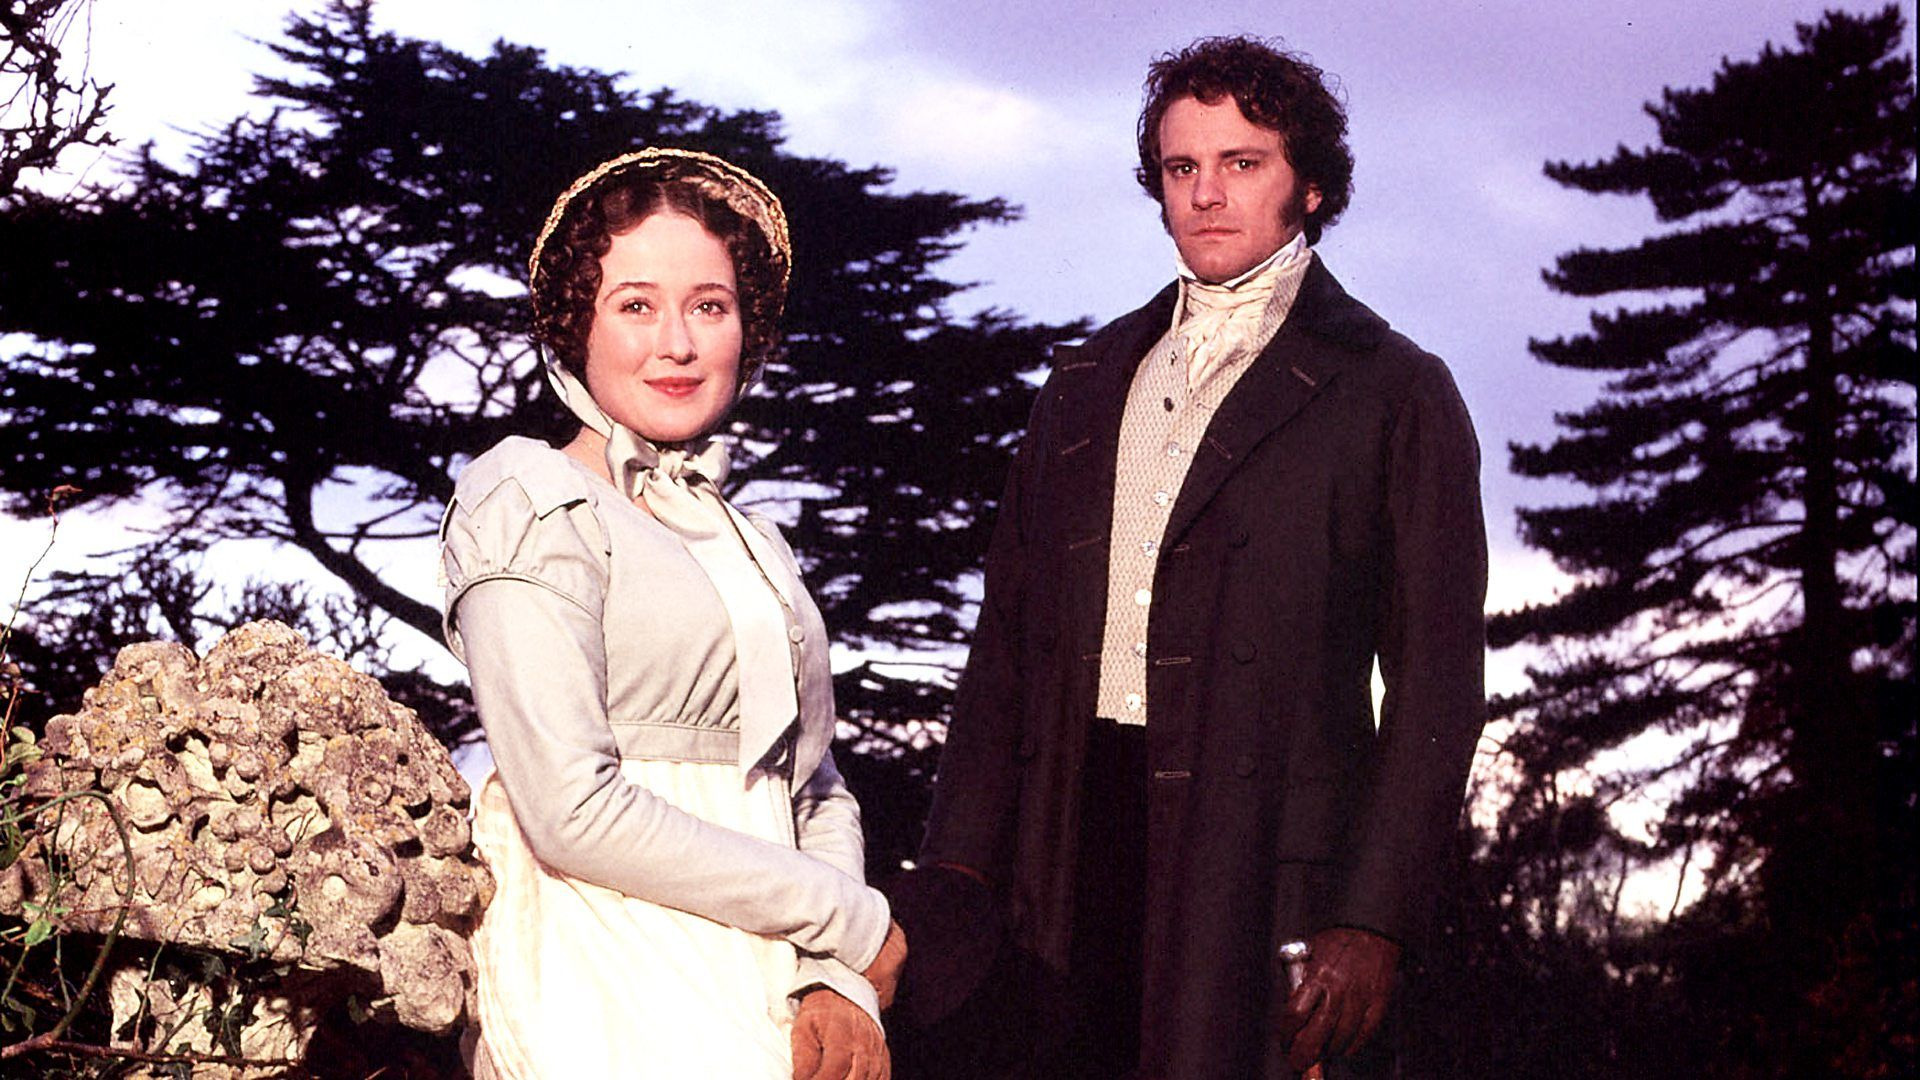
Pride and Prejudice
Drama, Romance/Dating
1995, UK
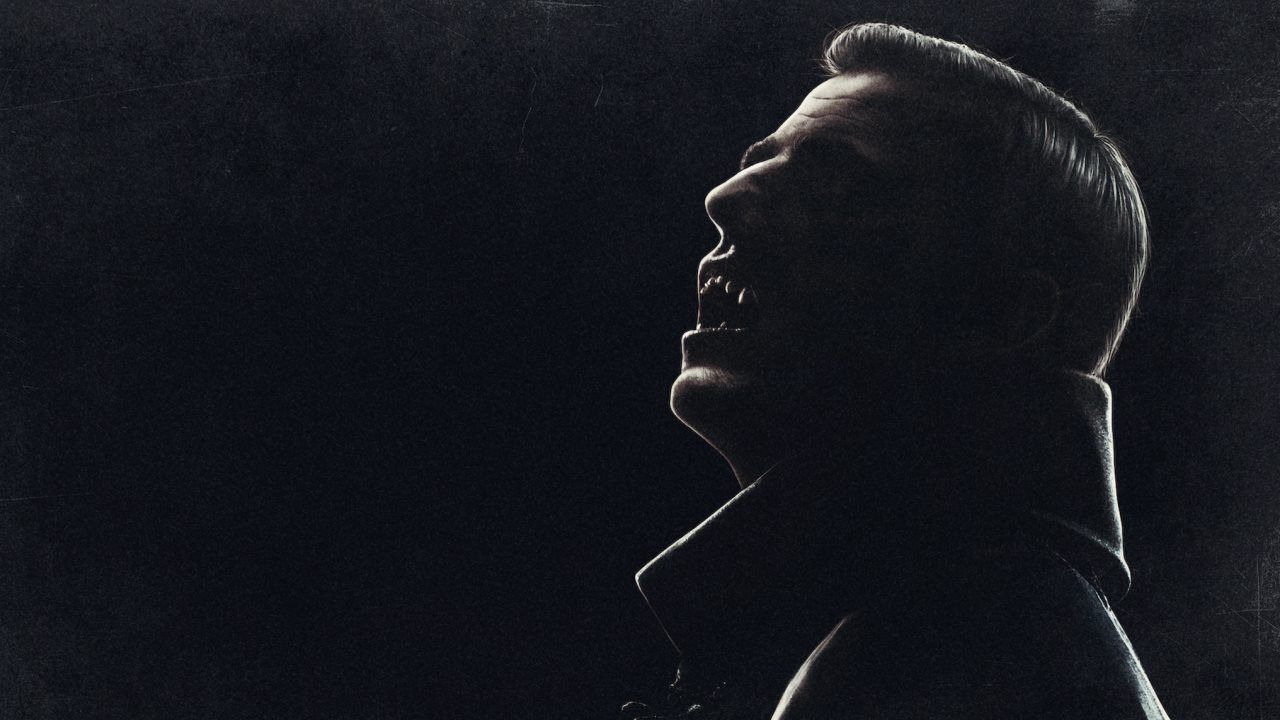
Dracula
Drama, Horror/Supernatural
2020, UK
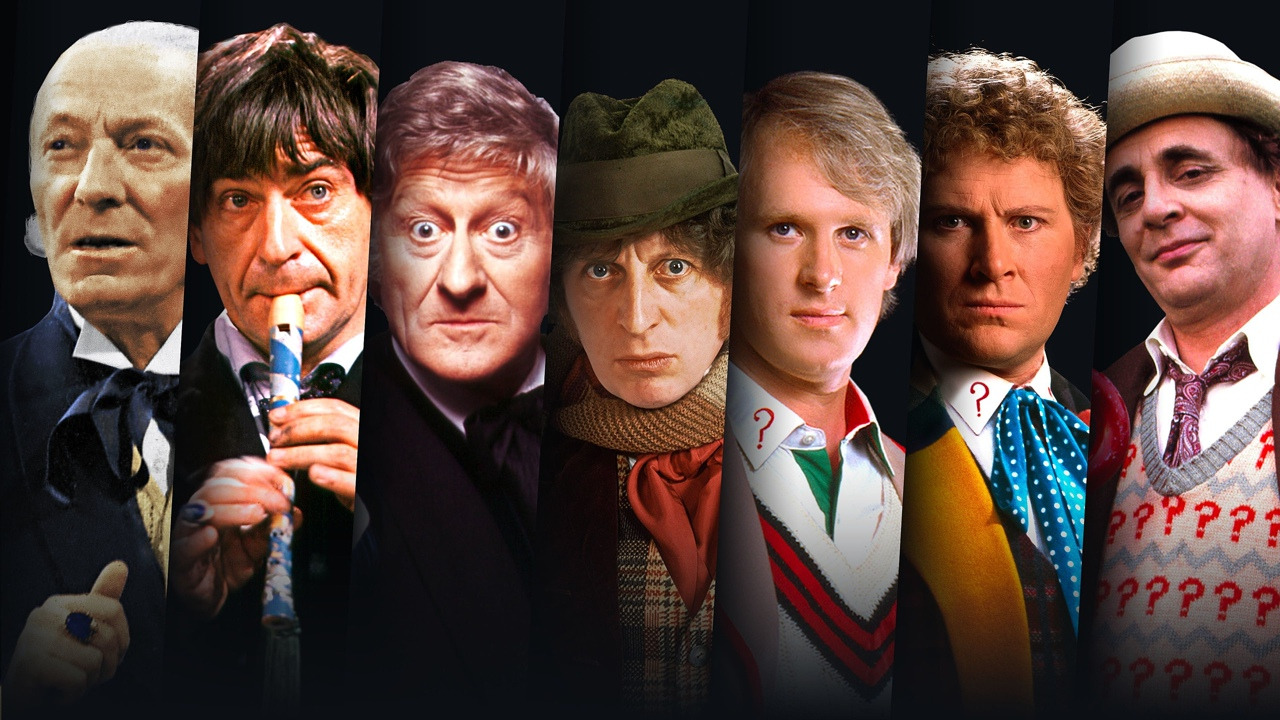
Doctor Who
Action, Adventure, Sci-Fi
1963, UK
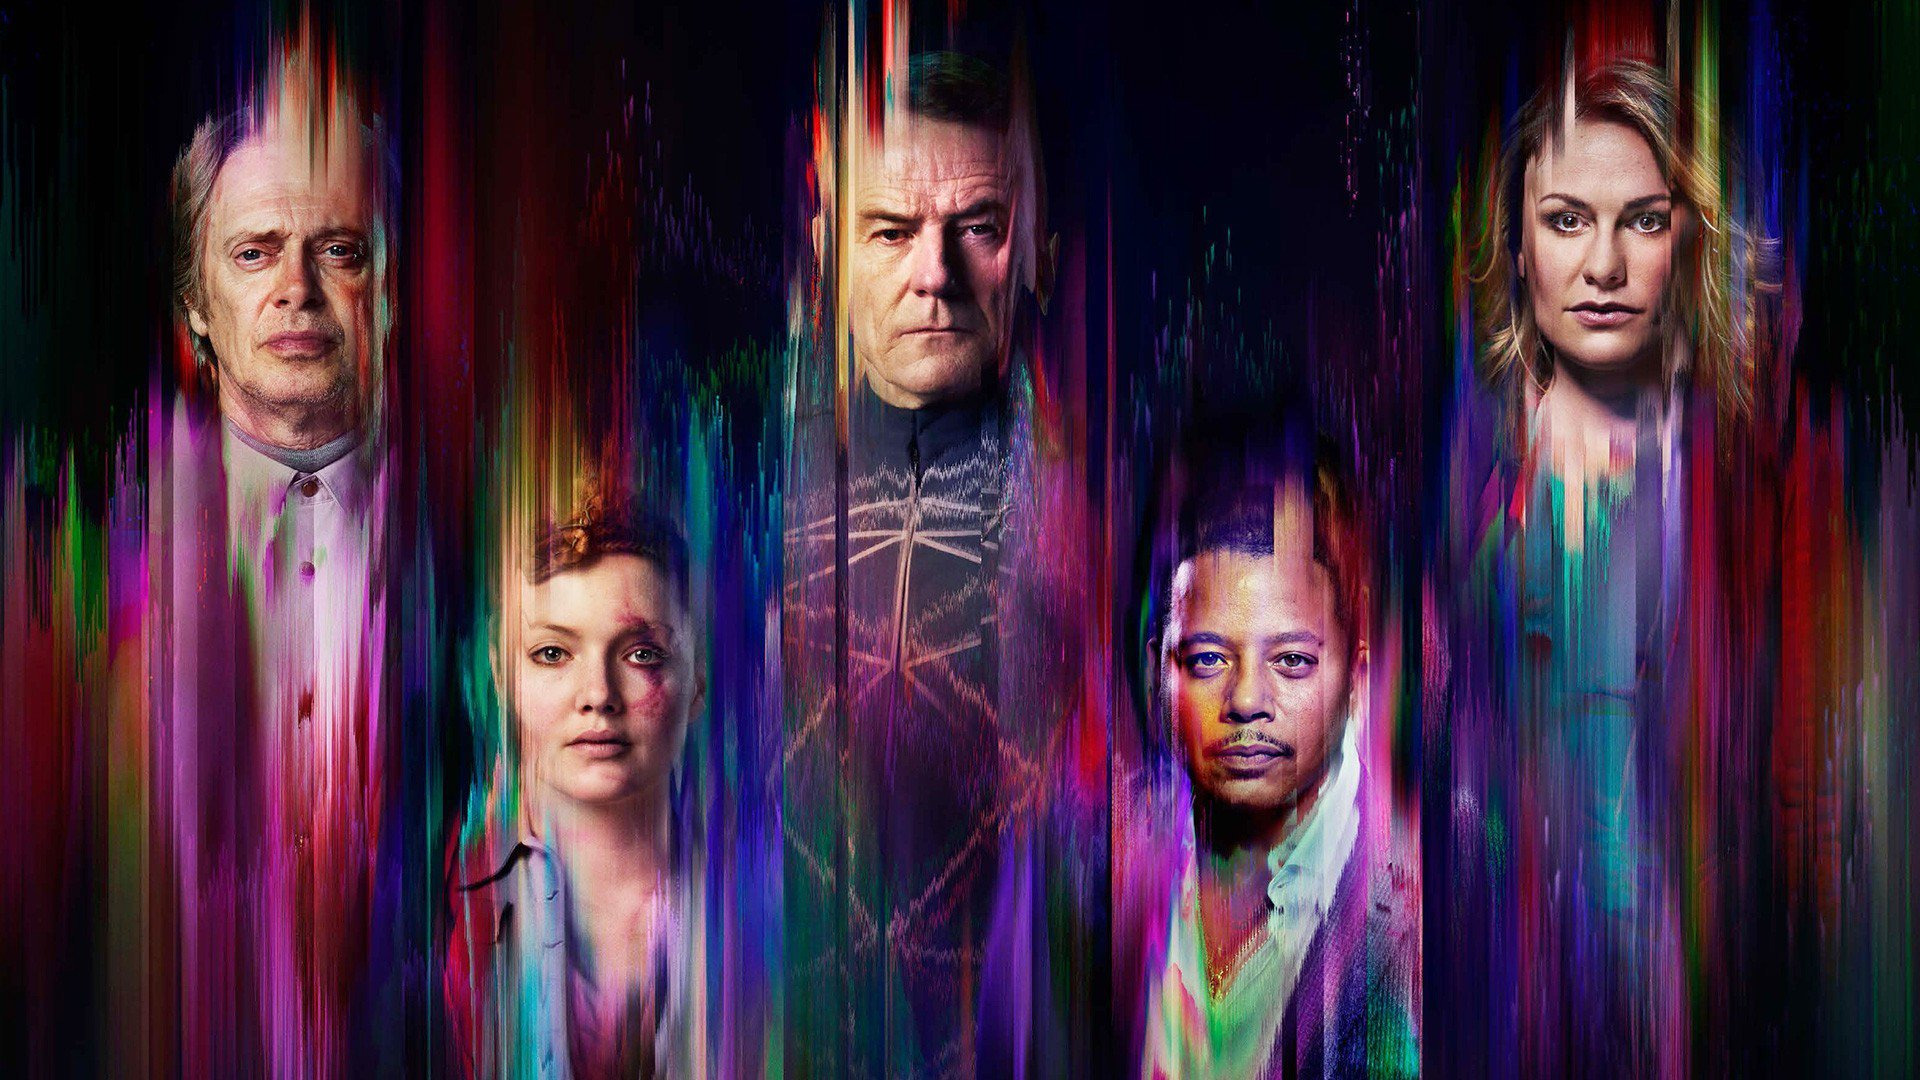
Philip K. Dick's Electric Dreams
Drama, Mystery, Sci-Fi
2017, UK
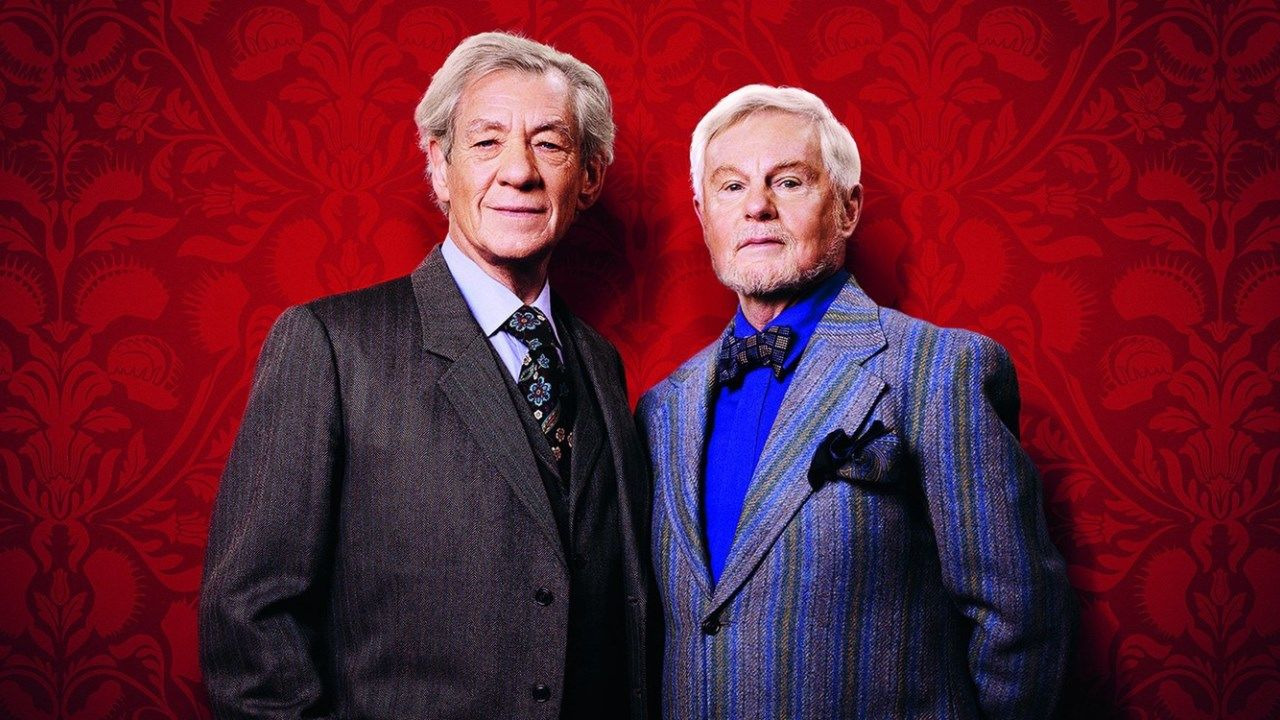
Vicious
Comedy
2013, UK

Mr. Bean
Comedy, Family
1990, UK

Utopia
Drama, Sci-Fi, Thriller
2013, UK

Normal People
Drama, Romance/Dating
2020, UK
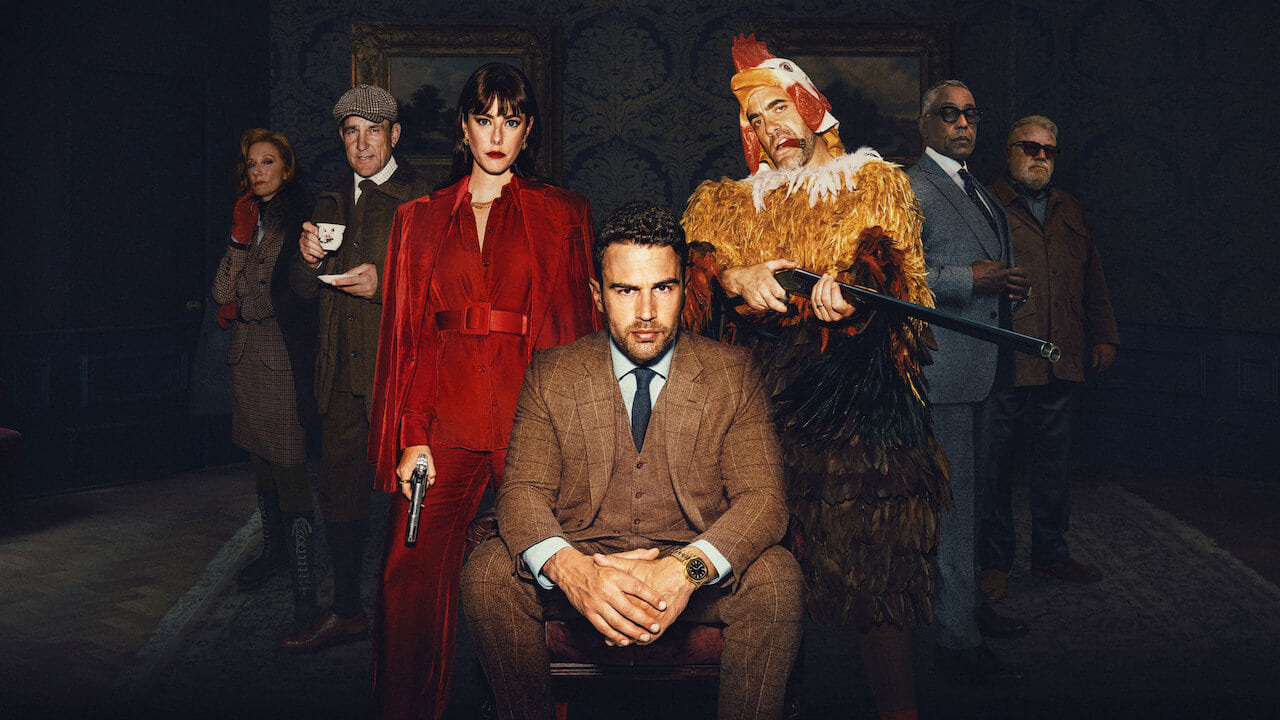
The Gentlemen
Action, Comedy, Crime
2024, UK

Top Gear
2002, UK

This is Going to Hurt
Comedy, Drama, Medical
2022, UK
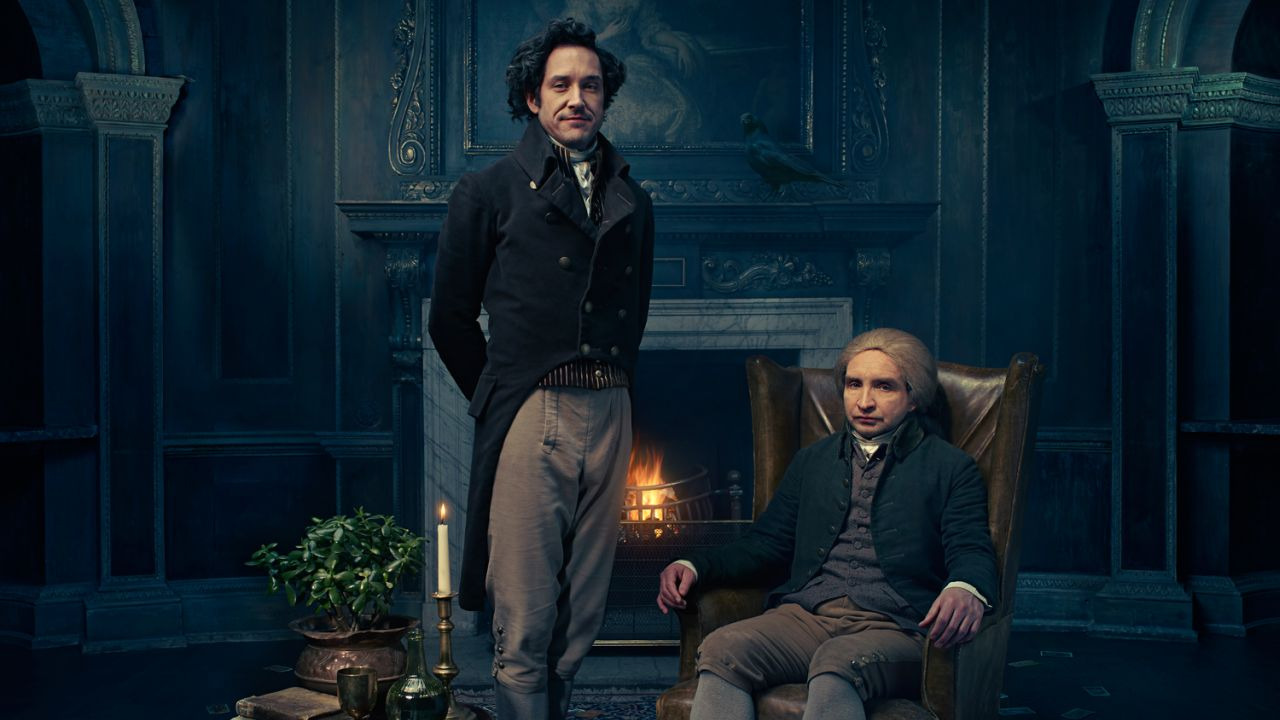
Jonathan Strange & Mr. Norrell
Drama, Fantasy
2014, UK
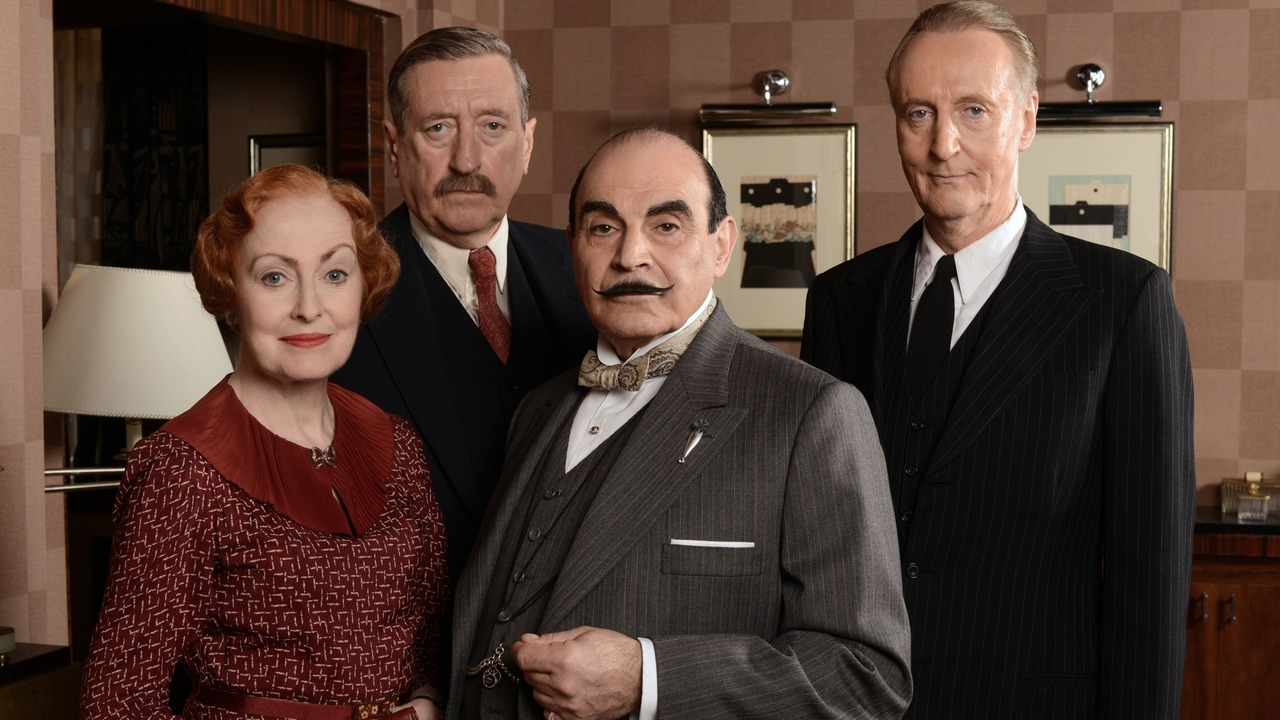
Agatha Christie's Poirot
Crime
1989, UK
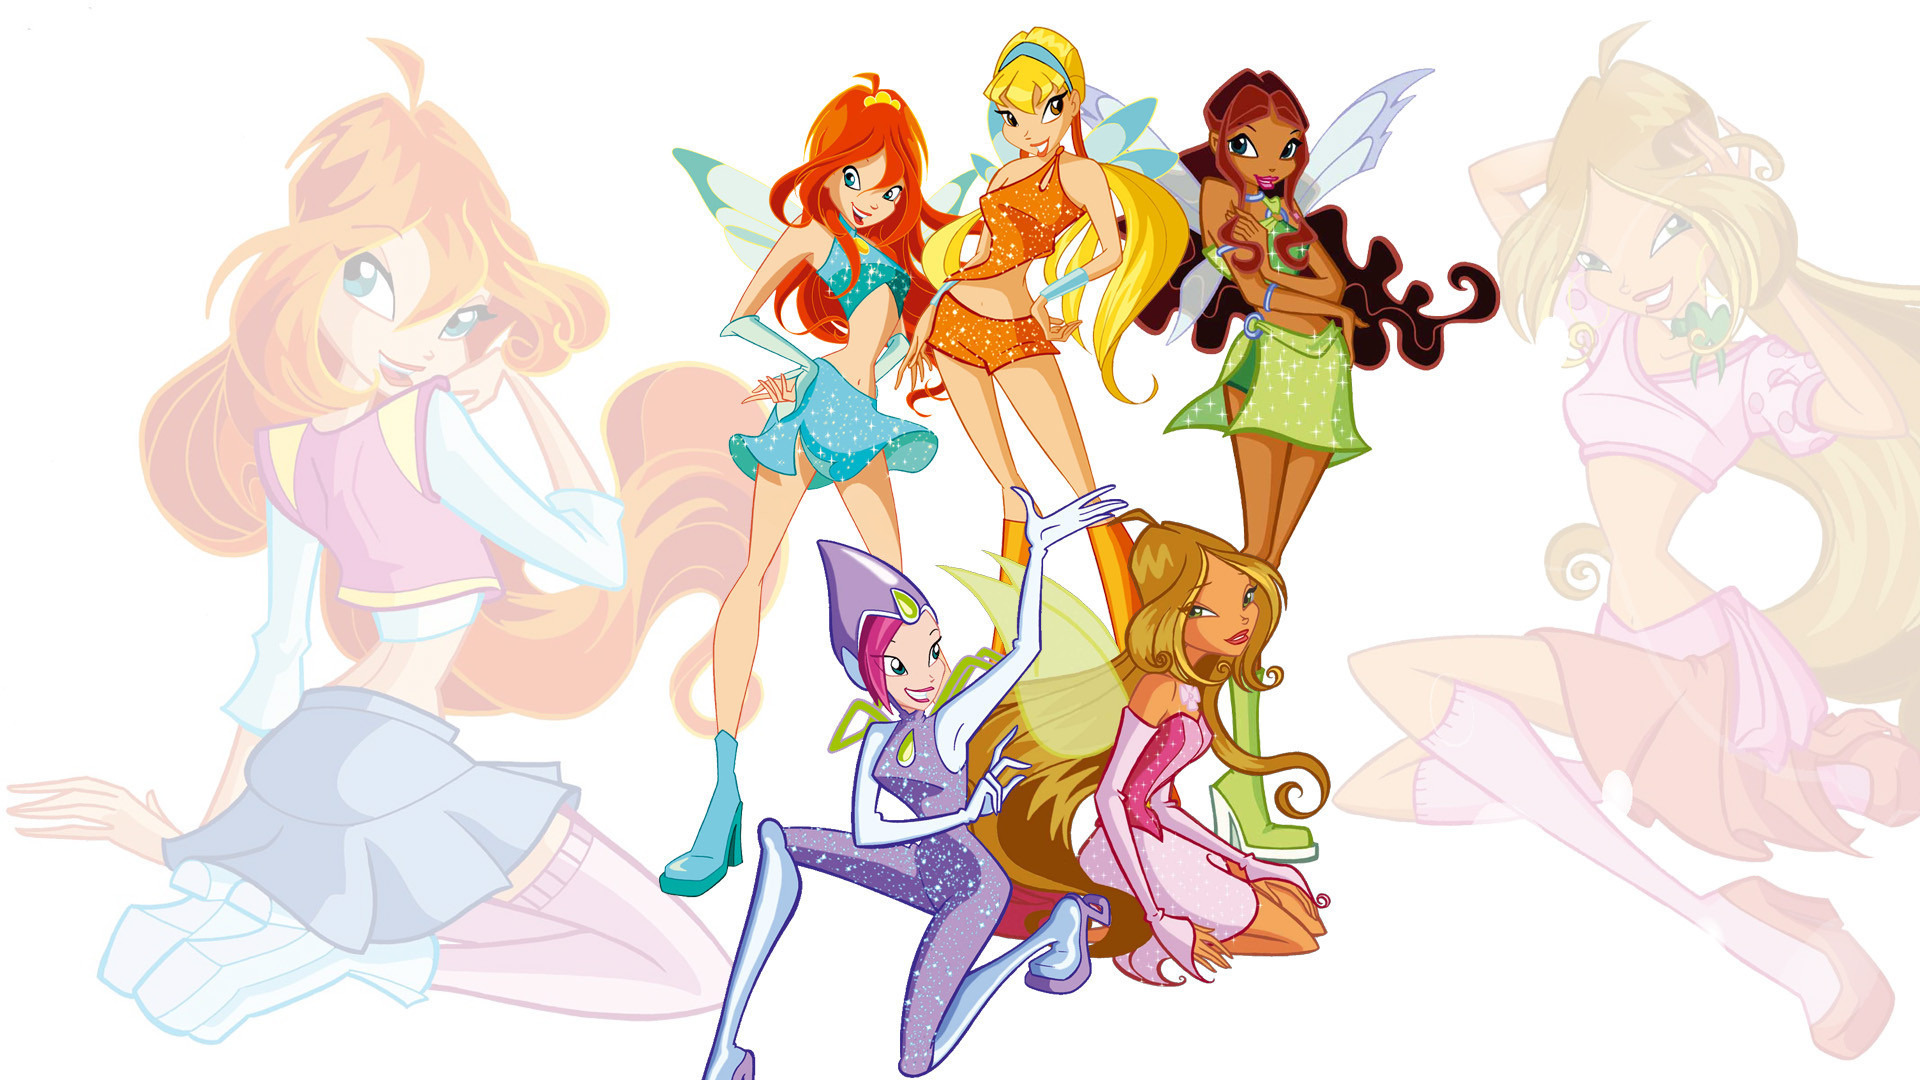
Winx Club
Adventure, Children
2004, UK

Staged
Comedy, Drama
2020, UK
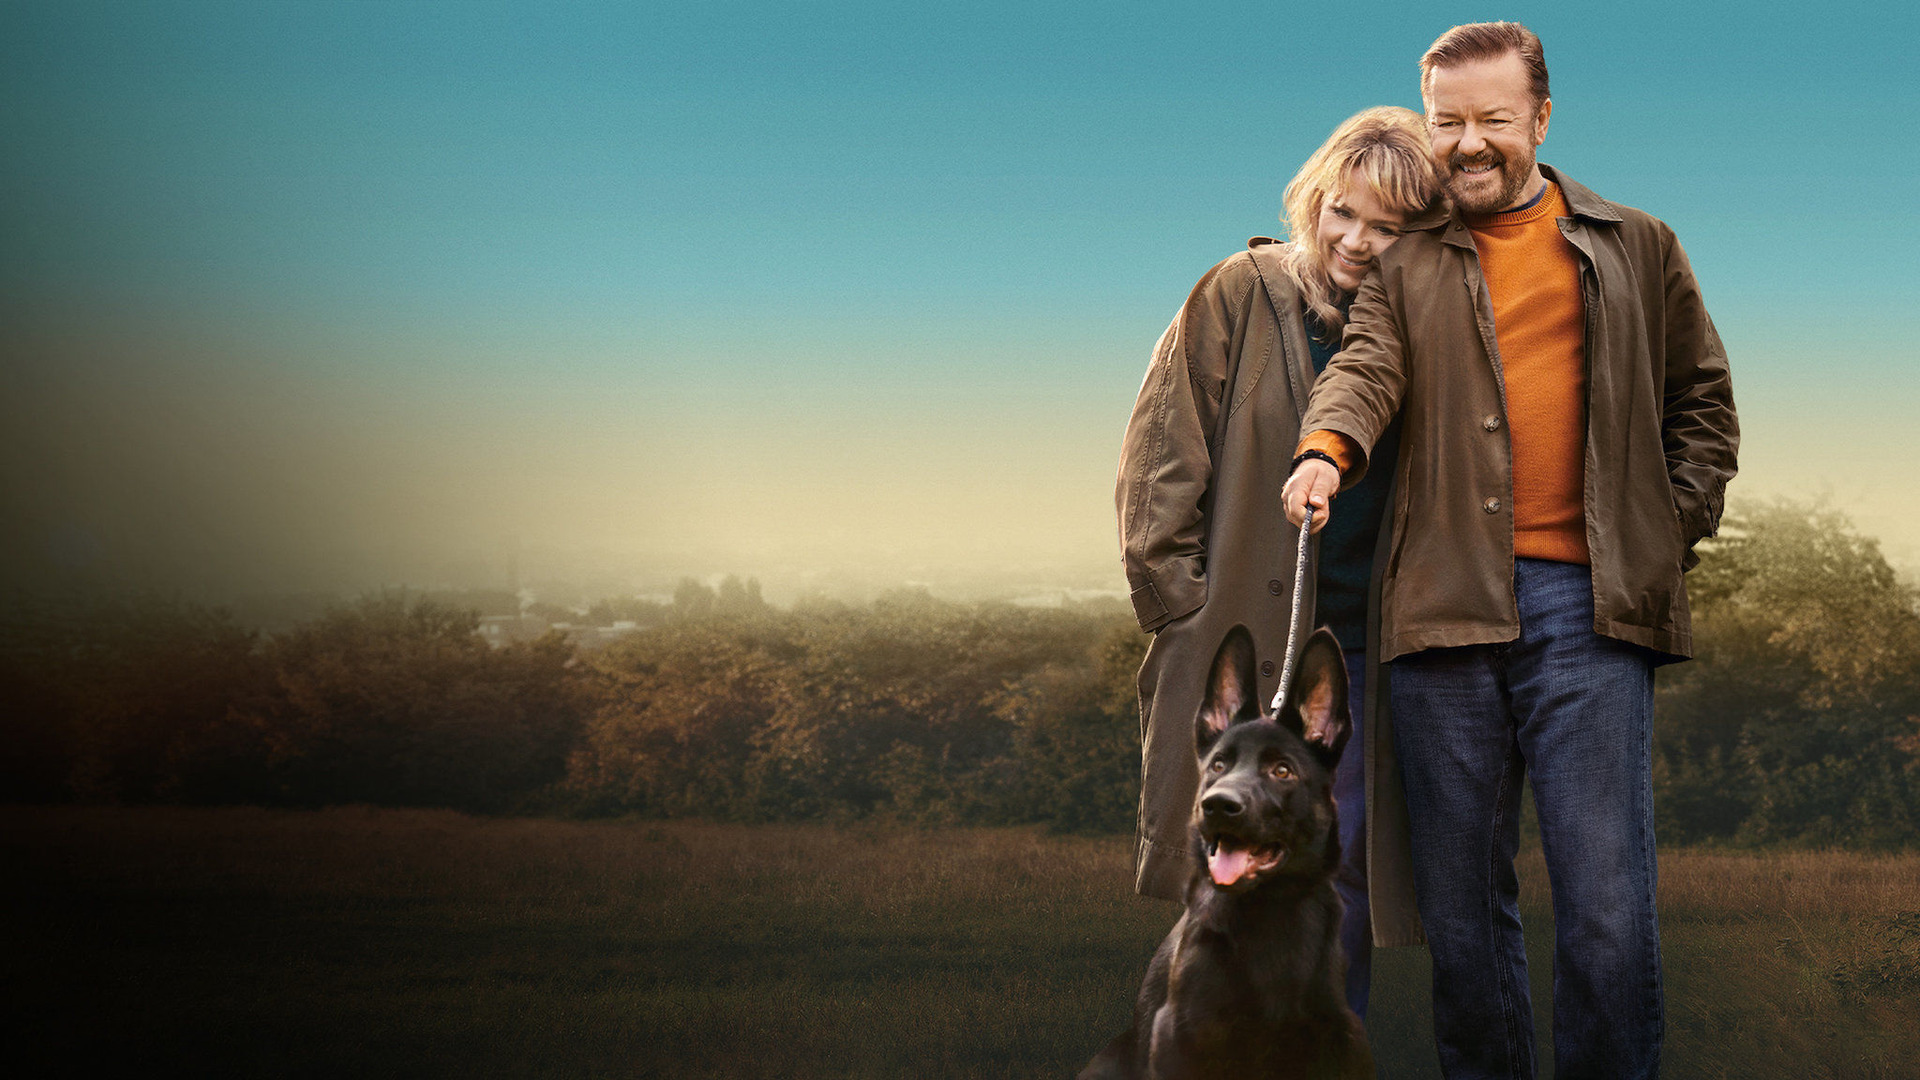
After Life
Comedy, Drama
2019, UK
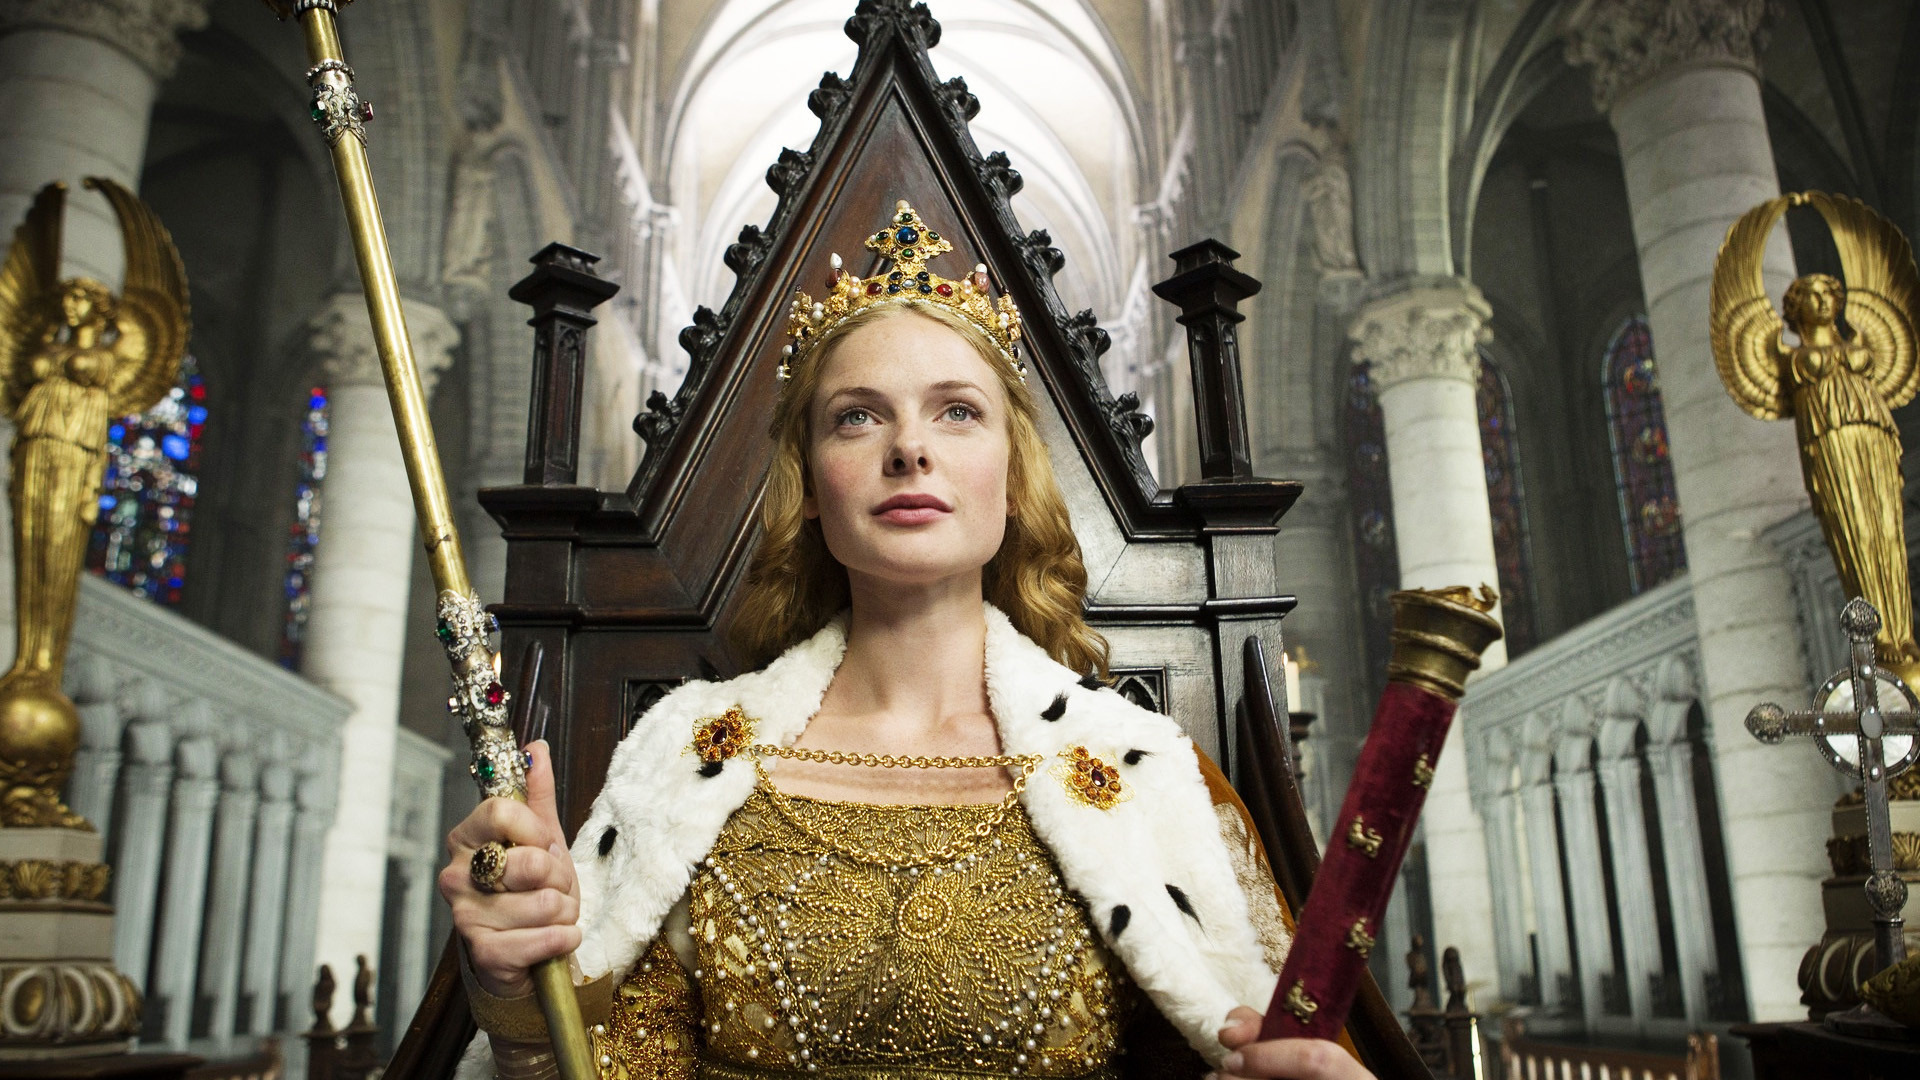
The White Queen
History, Drama
2013, UK
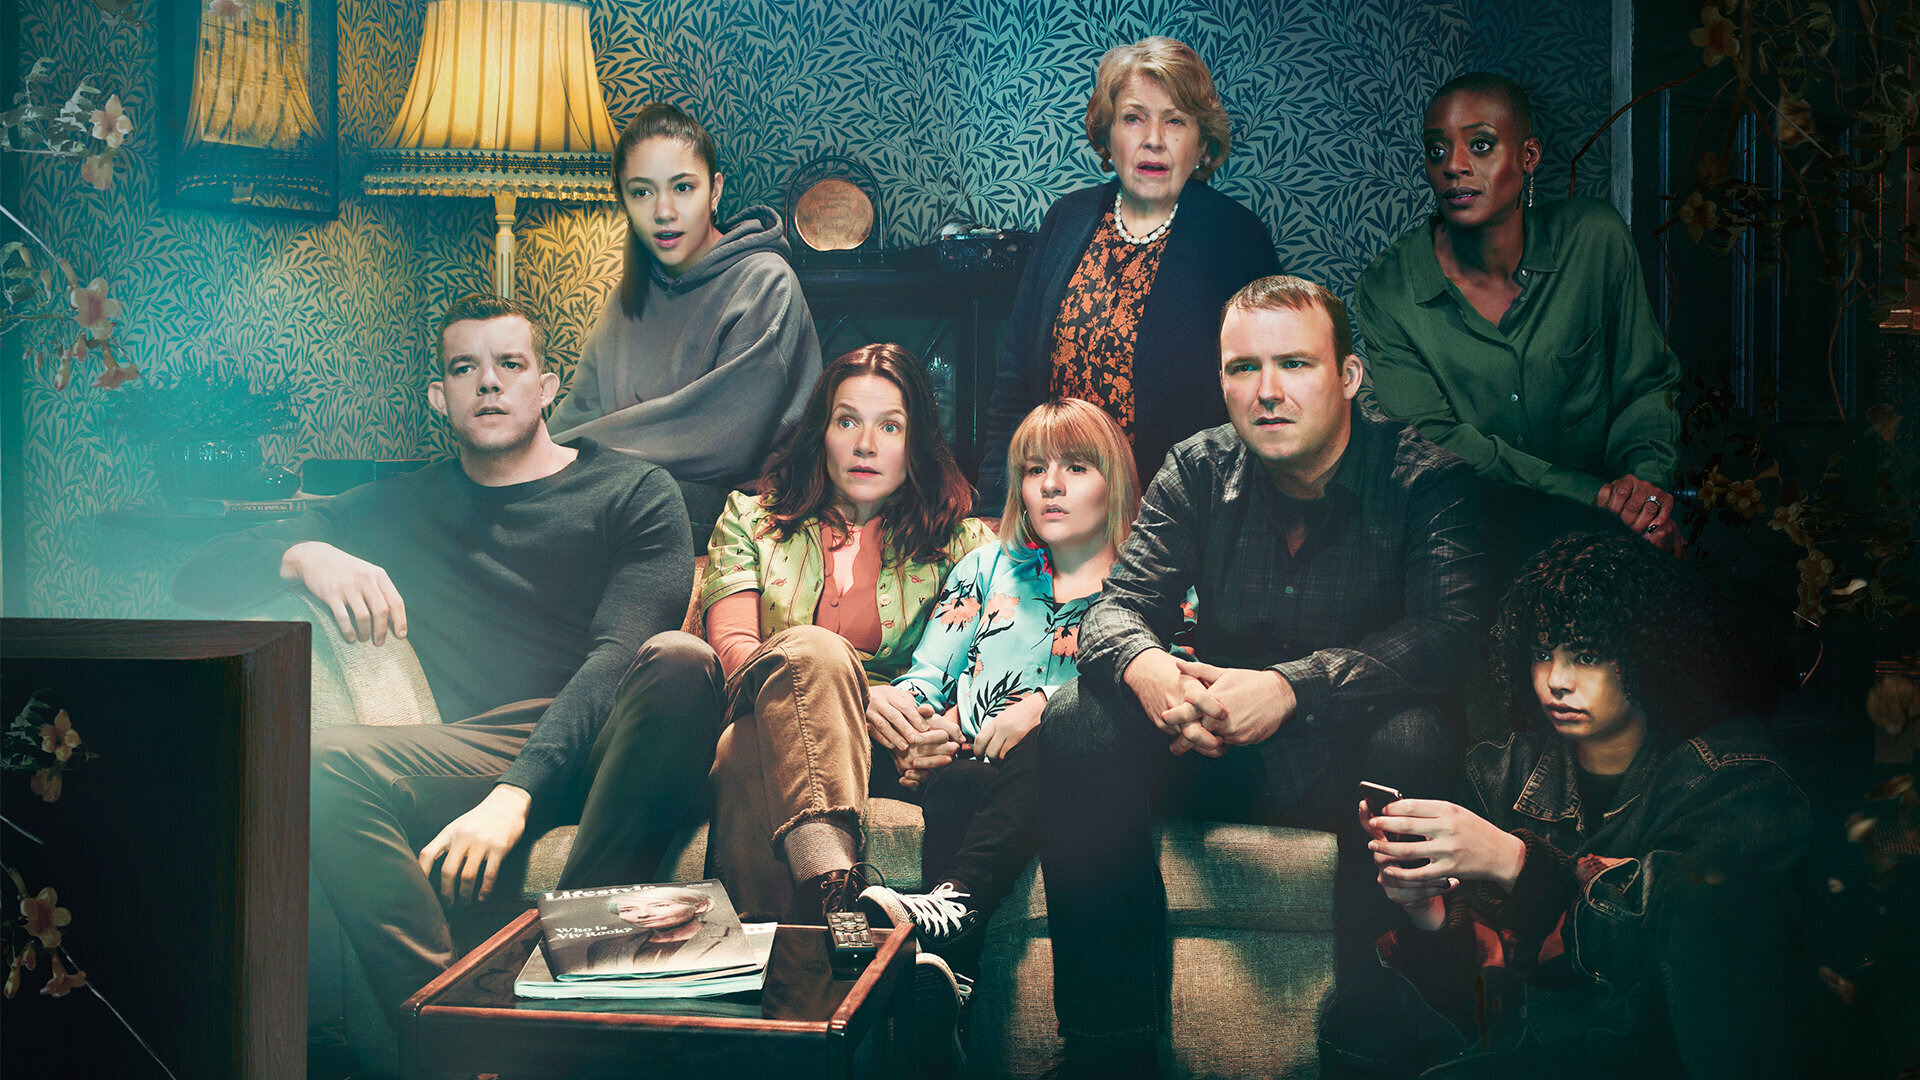
Years and Years
Drama, Family, Sci-Fi
2019, UK
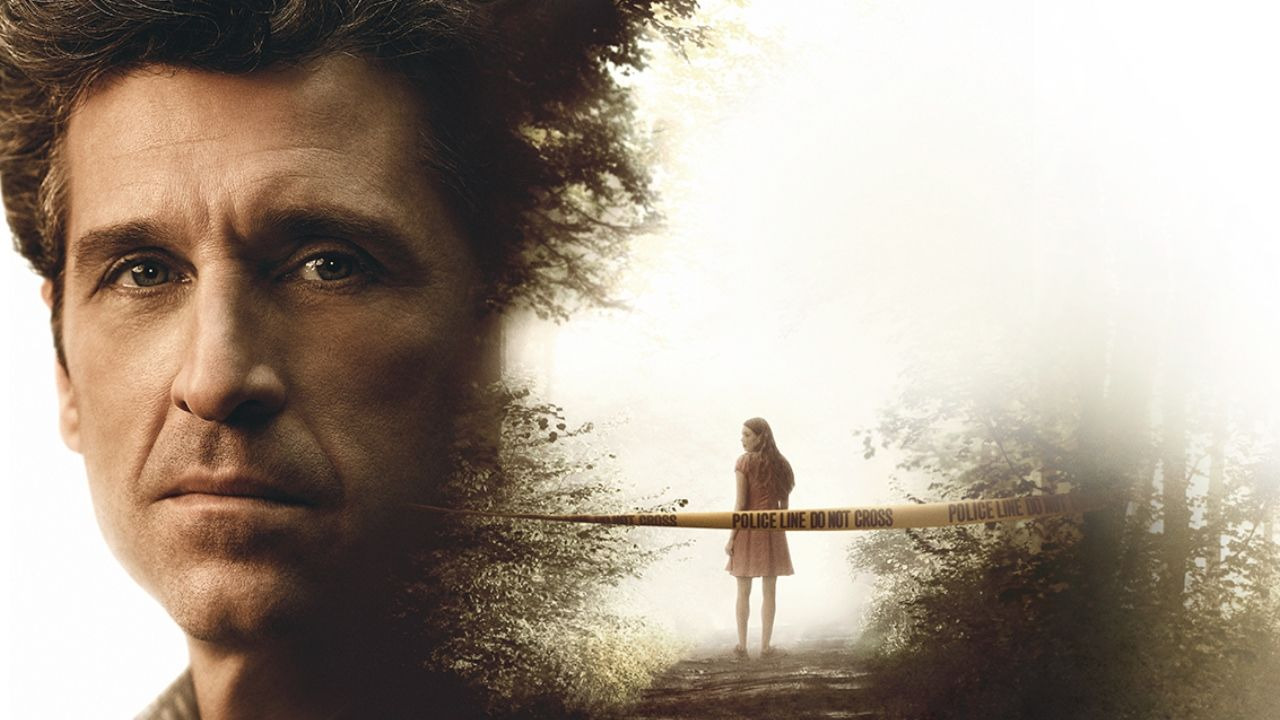
The Truth About the Harry Quebert Affair
Crime, Drama
2018, UK